
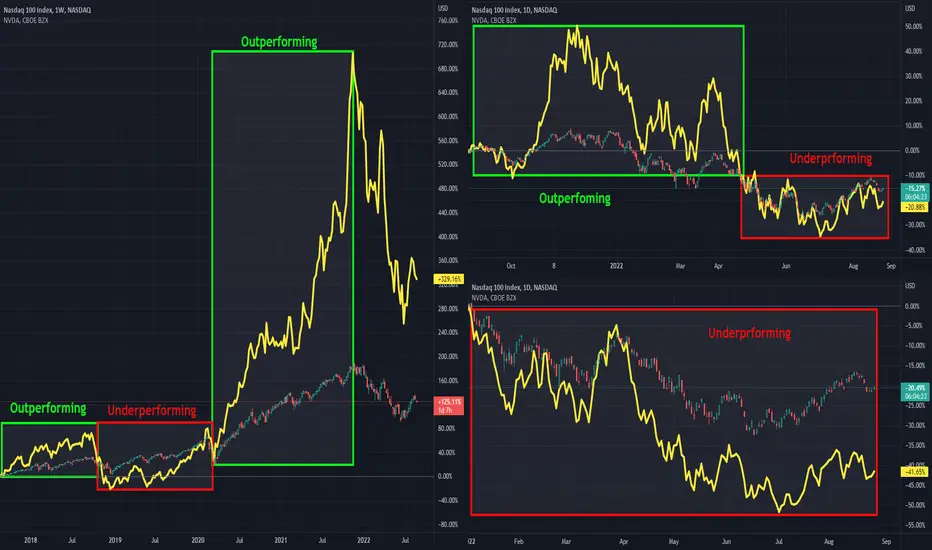
Wyckoff's stock selection process always included an analysis of comparative strength. To identify candidates for long positions, he looked for stocks or industries that were outperforming the market, both during trends and within trading ranges. In short positions, he looked for underperformers.
Therefore, he conducted his comparative strength analysis between a stock and the market, or between a stock and others in its industry.
Practical example: NASDAQ100 vs NVDA
5-year:

1-year:

YTD:

July-August 2022:

Conclusion: we can use outperforming stocks' charts with higher positive correlation as a leading indicator for Indexes!
Best,
Therefore, he conducted his comparative strength analysis between a stock and the market, or between a stock and others in its industry.
Practical example: NASDAQ100 vs NVDA
5-year:
1-year:
YTD:
July-August 2022:
Conclusion: we can use outperforming stocks' charts with higher positive correlation as a leading indicator for Indexes!
Best,

Use the following link to access trading ideas: patreon.com/SniperTraderStocks?utm_medium=unknown&utm_source=join_link&utm_campaign=creatorshare_creator&utm_content=copyLink
Exención de responsabilidad
La información y las publicaciones no constituyen, ni deben considerarse como, asesoramiento o recomendaciones financieras, de inversión, de trading u otro tipo, proporcionadas o respaldadas por TradingView. Obtenga más información en Condiciones de uso.
Use the following link to access trading ideas: patreon.com/SniperTraderStocks?utm_medium=unknown&utm_source=join_link&utm_campaign=creatorshare_creator&utm_content=copyLink
Exención de responsabilidad
La información y las publicaciones no constituyen, ni deben considerarse como, asesoramiento o recomendaciones financieras, de inversión, de trading u otro tipo, proporcionadas o respaldadas por TradingView. Obtenga más información en Condiciones de uso.