
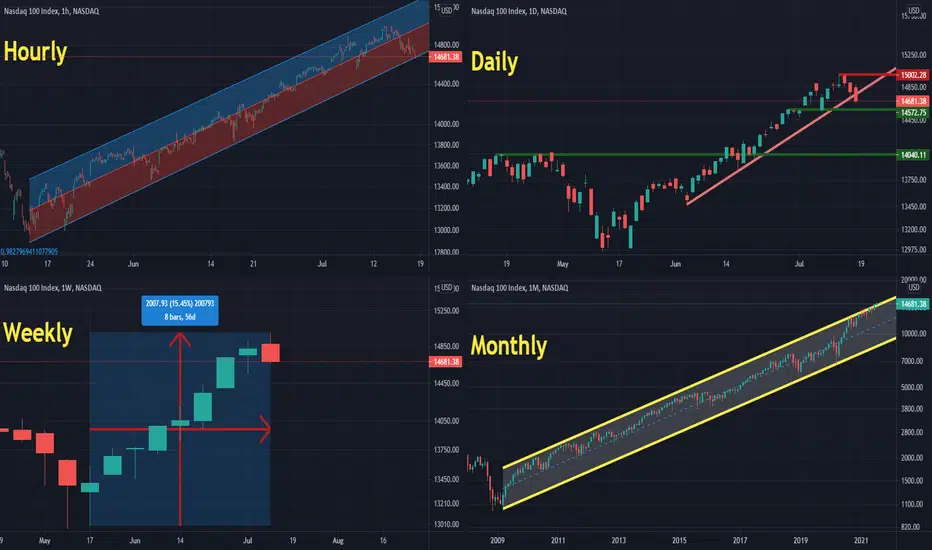
Hourly Chart: at the bottom of the regression channel.
Daily Chart: 3 Black crows and penetrating the bullish trend line. (very bearish signs)
Weekly Chart: failure to close at higher levels after 8 weeks..!shift in momentum to the downside. (Bearish)
Monthly Chart: Stagnating at the upper border of 12 years bullish trend
Conclusion: Most probable scenario could be testing 14500 and 14000 levels in the next 2 wks. Breaking above 15000 and closing above it for 2 days makes this analysis obsolete!
(retesting 14900 is also possible, but least likely!)
Educational Articles:
https://www.investopedia.com/terms/t/three_black_crows.asp
Daily Chart: 3 Black crows and penetrating the bullish trend line. (very bearish signs)
Weekly Chart: failure to close at higher levels after 8 weeks..!shift in momentum to the downside. (Bearish)
Monthly Chart: Stagnating at the upper border of 12 years bullish trend
Conclusion: Most probable scenario could be testing 14500 and 14000 levels in the next 2 wks. Breaking above 15000 and closing above it for 2 days makes this analysis obsolete!
(retesting 14900 is also possible, but least likely!)
Educational Articles:
https://www.investopedia.com/terms/t/three_black_crows.asp

Use the following link to access trading ideas: patreon.com/SniperTraderStocks?utm_medium=unknown&utm_source=join_link&utm_campaign=creatorshare_creator&utm_content=copyLink
Exención de responsabilidad
La información y las publicaciones no constituyen, ni deben considerarse como, asesoramiento o recomendaciones financieras, de inversión, de trading u otro tipo, proporcionadas o respaldadas por TradingView. Obtenga más información en Condiciones de uso.
Use the following link to access trading ideas: patreon.com/SniperTraderStocks?utm_medium=unknown&utm_source=join_link&utm_campaign=creatorshare_creator&utm_content=copyLink
Exención de responsabilidad
La información y las publicaciones no constituyen, ni deben considerarse como, asesoramiento o recomendaciones financieras, de inversión, de trading u otro tipo, proporcionadas o respaldadas por TradingView. Obtenga más información en Condiciones de uso.