
Hi Traders,
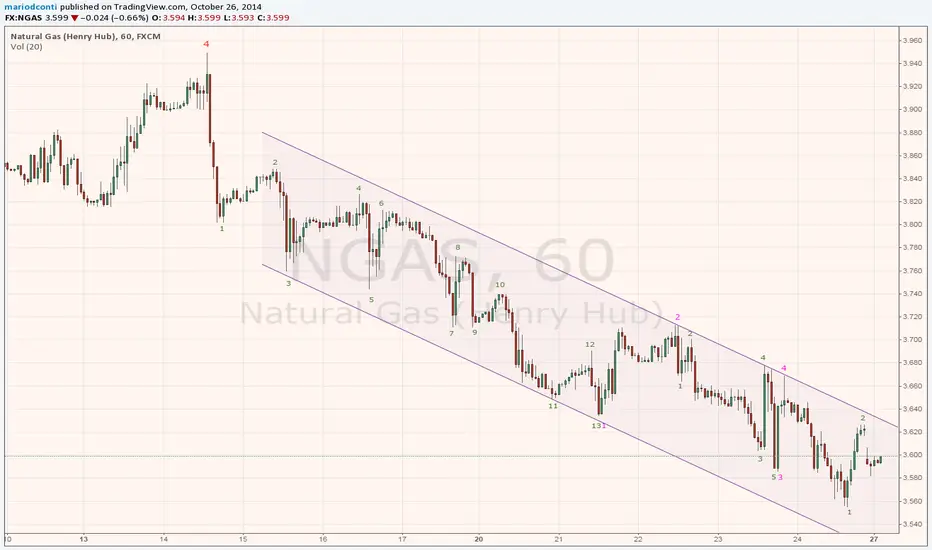
The end of the line of the downtrend of Natural Gas (now at 3601) is very much in sight. This sputtering downtrend is to be followed soon by a significant reversal that would mark the beginning of a major uptrend.
The attached 1-hour chart displays the sub-minuette waves 1 and 2 (in green, bottom right) as part of a group of a 5 waves down that should be completed at the beginning of the week.
At weekly and daily level, this is the very end of a major A-B-C retracement.
TARGETS
first down to the area 3515-3475
then up to the area 4163-4187
Cheers. Mario D. Conti
au.linkedin.com/in/sydneytraders/

Exención de responsabilidad
La información y las publicaciones no constituyen, ni deben considerarse como, asesoramiento o recomendaciones financieras, de inversión, de trading u otro tipo, proporcionadas o respaldadas por TradingView. Obtenga más información en Condiciones de uso.
Exención de responsabilidad
La información y las publicaciones no constituyen, ni deben considerarse como, asesoramiento o recomendaciones financieras, de inversión, de trading u otro tipo, proporcionadas o respaldadas por TradingView. Obtenga más información en Condiciones de uso.