
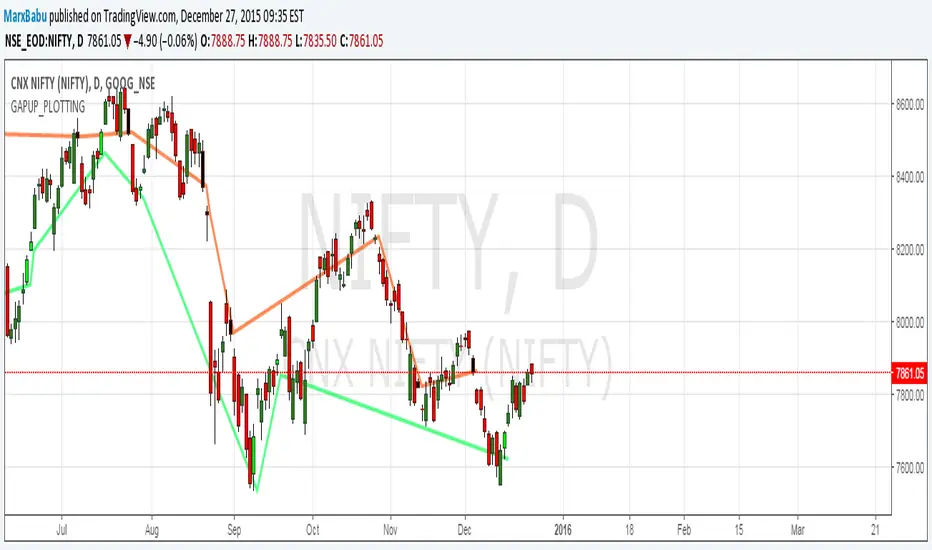
Identify the GAP up and GAP DOWN opening and plot the line.
Strategy when GAPUP identified Buy and target for few 100pips.
1.Color automated Lime candle shows one ahead candle of gapup
2.Black candle shows gapdown.
3.Line drawn for GapUp,GapDown
Strategy when GAPUP identified Buy and target for few 100pips.
1.Color automated Lime candle shows one ahead candle of gapup
2.Black candle shows gapdown.
3.Line drawn for GapUp,GapDown
Nota
The code is available here//version=2
//Author MarxBabu
study(title="GAPUP_PLOTTING", overlay = true)
isUp() => close > open
isDown() => close <= open
//GAP UP DECISION
isGapUp()=> low>low[1] and low>open[1] and low >high[1] and low >close[1] and isUp()
isGapDown()=>high<low[1] and high<open[1] and high< close[1] and high<high[1] and isDown()
x = if isGapUp()
currentLowValue =low[1]
y = if isGapDown()
currentLowValue =close[1]
plot(x, style=line, linewidth=3, color=lime)
plot(y, style=line, linewidth=3, color=red)
barcolor(isGapUp()? #00FF00 :na,-1)
barcolor(isGapDown() ? #030303 :na,-1)

🌳Indicator:bit.ly/2DJVXDn 💚
🦄telegram:t.me/longbuylongsellindicator 🟢
✔️contact:t.me/wealthworldmajic
🎯web:marxcbabu.blogspot.com/
🟠twitter:twitter.com/marxcbabu 💲
youtube.com/@marxcbabu/videos
🦄telegram:t.me/longbuylongsellindicator 🟢
✔️contact:t.me/wealthworldmajic
🎯web:marxcbabu.blogspot.com/
🟠twitter:twitter.com/marxcbabu 💲
youtube.com/@marxcbabu/videos
Exención de responsabilidad
La información y las publicaciones no constituyen, ni deben considerarse como, asesoramiento o recomendaciones financieras, de inversión, de trading u otro tipo, proporcionadas o respaldadas por TradingView. Obtenga más información en Condiciones de uso.
🌳Indicator:bit.ly/2DJVXDn 💚
🦄telegram:t.me/longbuylongsellindicator 🟢
✔️contact:t.me/wealthworldmajic
🎯web:marxcbabu.blogspot.com/
🟠twitter:twitter.com/marxcbabu 💲
youtube.com/@marxcbabu/videos
🦄telegram:t.me/longbuylongsellindicator 🟢
✔️contact:t.me/wealthworldmajic
🎯web:marxcbabu.blogspot.com/
🟠twitter:twitter.com/marxcbabu 💲
youtube.com/@marxcbabu/videos
Exención de responsabilidad
La información y las publicaciones no constituyen, ni deben considerarse como, asesoramiento o recomendaciones financieras, de inversión, de trading u otro tipo, proporcionadas o respaldadas por TradingView. Obtenga más información en Condiciones de uso.