
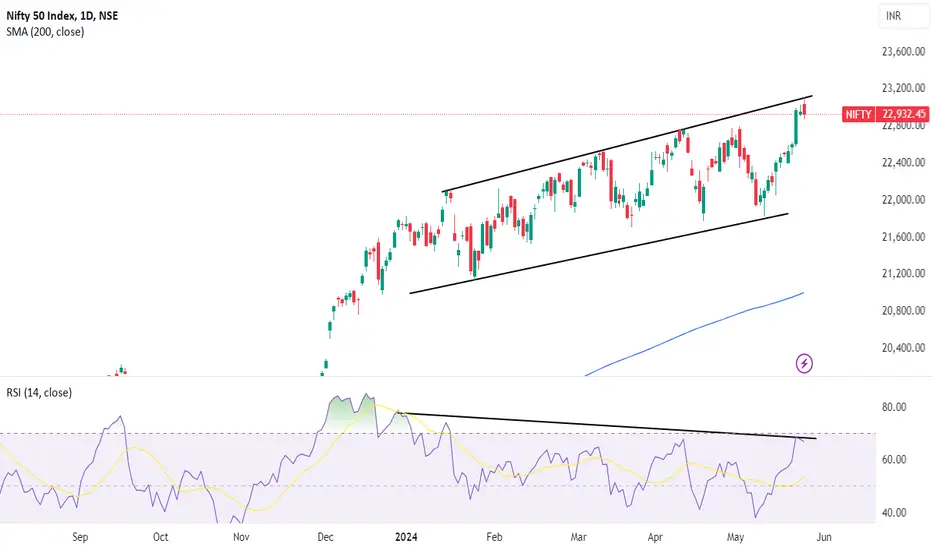
Also there is a formation Bearish RSI Divergence daily chart. On 15 January index reached a high of 22115 and the RSI value was at 74 today index reached a new high of 23043 but the RSI was at 67 this is a clear formation of RSI divergence.
Nota
today it really downNota
🤕
Exención de responsabilidad
La información y las publicaciones no constituyen, ni deben considerarse como, asesoramiento o recomendaciones financieras, de inversión, de trading u otro tipo, proporcionadas o respaldadas por TradingView. Obtenga más información en Condiciones de uso.
Exención de responsabilidad
La información y las publicaciones no constituyen, ni deben considerarse como, asesoramiento o recomendaciones financieras, de inversión, de trading u otro tipo, proporcionadas o respaldadas por TradingView. Obtenga más información en Condiciones de uso.