This Analysis is not a trade recommendation, this study is purely for education purpose only, Do your own Study and Research before getting into any trades.
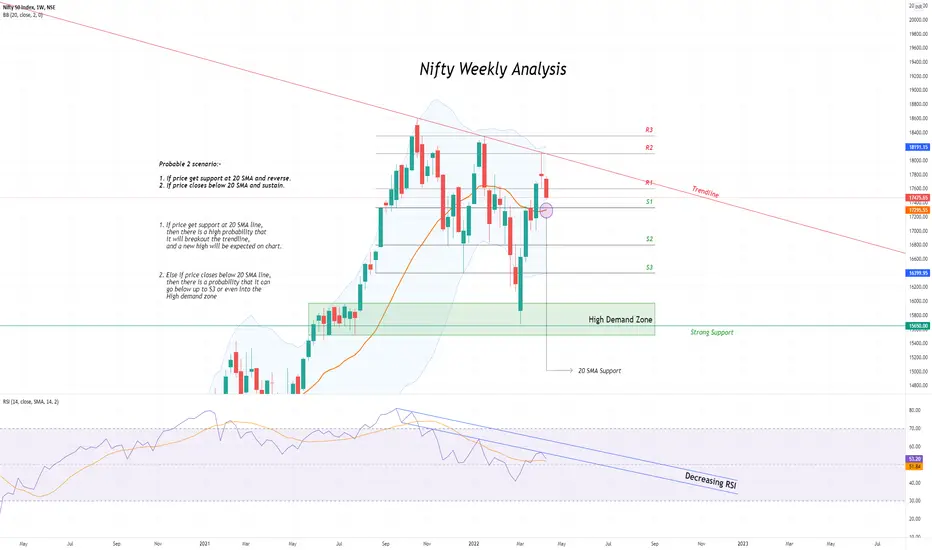
 NIFTY Weekly Analysis.
Currently Nifty is showing weakness on chart:-
1. Did not touch the upper Bollinger Band.
2. Continuously decreasing RSI.
If it fails to get support at the 20 SMA line, then there is a chance that nifty may touch the lower Bollinger Band at S3
NIFTY Weekly Analysis.Currently Nifty is showing weakness on chart:-
1. Did not touch the upper Bollinger Band.
2. Continuously decreasing RSI.
If it fails to get support at the 20 SMA line, then there is a chance that nifty may touch the lower Bollinger Band at S3

Exención de responsabilidad
La información y las publicaciones no constituyen, ni deben considerarse como, asesoramiento o recomendaciones financieras, de inversión, de trading u otro tipo, proporcionadas o respaldadas por TradingView. Obtenga más información en Condiciones de uso.
Exención de responsabilidad
La información y las publicaciones no constituyen, ni deben considerarse como, asesoramiento o recomendaciones financieras, de inversión, de trading u otro tipo, proporcionadas o respaldadas por TradingView. Obtenga más información en Condiciones de uso.