
Technical & Geopolitical Assessment of Potential Reversal :-
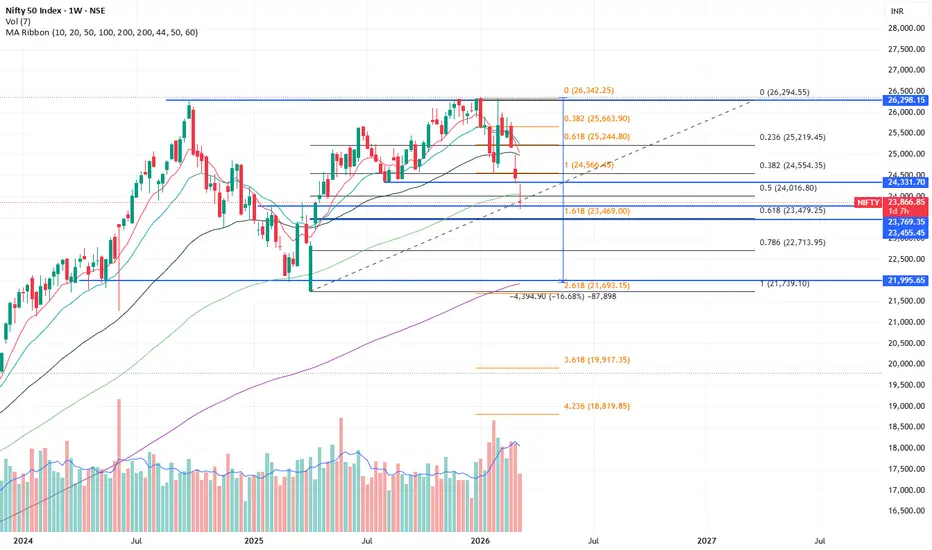
The Nifty 50 is currently navigating a period of high volatility driven by the escalating Iran–US–Israel conflict and a subsequent oil shock (Brent crude peaking near $120). From its January peak of 26,373, the index has entered a correction phase, currently trading near the 23,800–24,000 zone. Technical indicators and historical precedents suggest that while the primary trend is bearish, the index is approaching a "Value Zone" where a major reversal could materialize.
2. Historical Context: Geopolitical Draw downs Historical data from ICICI Securities reinforces that geopolitical shocks often result in a maximum "panic drawdown" of approximately 18%.
Event Max Correction (%) Impact Duration 9/11 Attacks~18% Sharp,
short-term Russia-Ukraine War~10-12% Sustained volatility
Current Conflict (2026)~9.5% (to date) Ongoing Prediction Alignment:
An 18% correction from the 26,373 peak equates to 21,625. This aligns remarkably well with your identified support zone of 22,000.
3. Technical Analysis & Elliott Wave Structure The technical chart indicates a structural "Flat Correction" on the monthly timeframe, further validated by a Monthly Evening Star pattern with bearish divergence.
Elliott Wave Perspective: * Wave 2 (Relief Rally) concluded during the post-Budget bounce Wave 3 (Impulsive Downward) is currently active.
Fibonacci Targets: Wave 3 typically extends to 1.618% of Wave 1. Based on current volatility, targets are clustered at 23,500 (immediate) and 22,000–22,750 (extended).
Support Breach: The decisive break below 24,300 has shifted the psychological floor to the 23,800 mark. A failure to hold 23,800 on a weekly closing basis opens the "Trap Door" to the 22,000 level.
4. Reversal Level Prediction :-Based on the confluence of technical and fundamental data, we identify two primary zones for a potential reversal:
Zone A: The "Supportive" Reversal (23,500 – 23,700)
Rationale: This represents the 61.8% Fibonacci retracement of the 2025-2026 up move. Probability: High for a short-term "relief bounce.
"Zone B: The "Historical Bottom" (21,800 – 22,200)
Rationale: Represents the 16-18% historical max drawdown and the end of the 5-wave Elliott structure. Probability: High for a long-term structural bottom if geopolitical tensions escalate further.
The Nifty 50 is currently navigating a period of high volatility driven by the escalating Iran–US–Israel conflict and a subsequent oil shock (Brent crude peaking near $120). From its January peak of 26,373, the index has entered a correction phase, currently trading near the 23,800–24,000 zone. Technical indicators and historical precedents suggest that while the primary trend is bearish, the index is approaching a "Value Zone" where a major reversal could materialize.
2. Historical Context: Geopolitical Draw downs Historical data from ICICI Securities reinforces that geopolitical shocks often result in a maximum "panic drawdown" of approximately 18%.
Event Max Correction (%) Impact Duration 9/11 Attacks~18% Sharp,
short-term Russia-Ukraine War~10-12% Sustained volatility
Current Conflict (2026)~9.5% (to date) Ongoing Prediction Alignment:
An 18% correction from the 26,373 peak equates to 21,625. This aligns remarkably well with your identified support zone of 22,000.
3. Technical Analysis & Elliott Wave Structure The technical chart indicates a structural "Flat Correction" on the monthly timeframe, further validated by a Monthly Evening Star pattern with bearish divergence.
Elliott Wave Perspective: * Wave 2 (Relief Rally) concluded during the post-Budget bounce Wave 3 (Impulsive Downward) is currently active.
Fibonacci Targets: Wave 3 typically extends to 1.618% of Wave 1. Based on current volatility, targets are clustered at 23,500 (immediate) and 22,000–22,750 (extended).
Support Breach: The decisive break below 24,300 has shifted the psychological floor to the 23,800 mark. A failure to hold 23,800 on a weekly closing basis opens the "Trap Door" to the 22,000 level.
4. Reversal Level Prediction :-Based on the confluence of technical and fundamental data, we identify two primary zones for a potential reversal:
Zone A: The "Supportive" Reversal (23,500 – 23,700)
Rationale: This represents the 61.8% Fibonacci retracement of the 2025-2026 up move. Probability: High for a short-term "relief bounce.
"Zone B: The "Historical Bottom" (21,800 – 22,200)
Rationale: Represents the 16-18% historical max drawdown and the end of the 5-wave Elliott structure. Probability: High for a long-term structural bottom if geopolitical tensions escalate further.

Publicaciones relacionadas
Exención de responsabilidad
La información y las publicaciones no constituyen, ni deben considerarse como, asesoramiento o recomendaciones financieras, de inversión, de trading u otro tipo, proporcionadas o respaldadas por TradingView. Obtenga más información en Condiciones de uso.
Publicaciones relacionadas
Exención de responsabilidad
La información y las publicaciones no constituyen, ni deben considerarse como, asesoramiento o recomendaciones financieras, de inversión, de trading u otro tipo, proporcionadas o respaldadas por TradingView. Obtenga más información en Condiciones de uso.