
Wrap-up:-
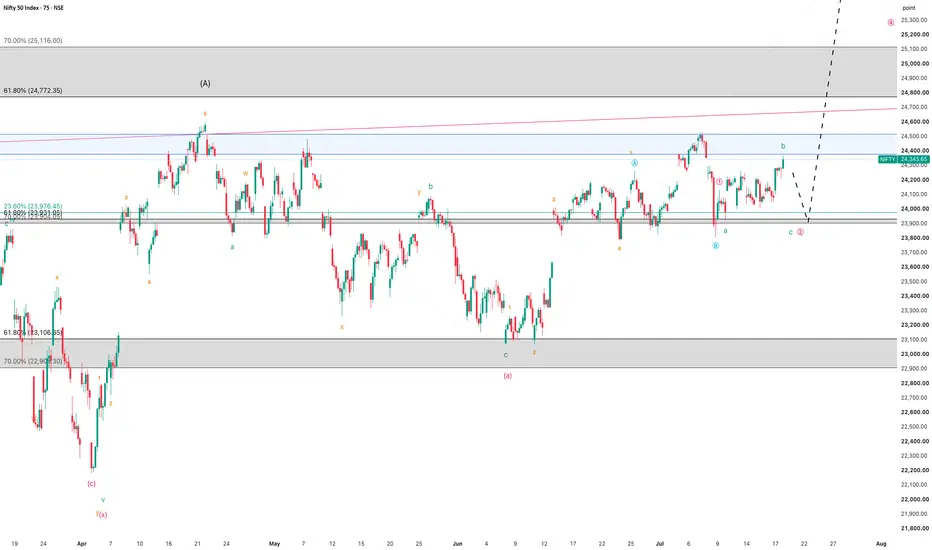
As discussed in my previous Mid-Term NIFTY Analysis (Weekly Chart published on 11 July 2026), the market continues to trade within Wave Y of Wave X of the larger Major Wave 4 corrective structure.
Within Wave Y, Wave A concluded at 24,601, and Wave B is currently unfolding.
Based on the latest price structure, Wave B appears to be developing as an ABC Irregular Correction.
The internal structure is currently interpreted as follows:
Internal Wave A of Wave B completed at 23,070.
Internal Wave B is currently unfolding.
Within this Internal Wave B:
Internal Wave A completed at 24,261.
Internal Wave B concluded at 23,805, by forming an Irregular Correction, as NIFTY moved below the 38.2% Fibonacci retracement level (23,972).
Consequently, Internal Wave C is now expected to be in progress.
What I'm Watching | 20 July – 24 July 2026
With the apparent completion of Internal Wave B within the ongoing corrective structure, the market may now be transitioning into Internal Wave C.
Within this wave:
Wave 1 appears to have completed at 24,134.
Wave 2 is currently in progress.
If this wave count remains valid, the completion of Wave 2 could pave the way for Wave 3, which is typically the strongest and most impulsive leg in an Elliott Wave sequence.
A sustained move above key resistance levels would strengthen the bullish case.
Key Levels to Watch
Immediate Resistance: 24,530
Major Resistance: 24,601
Bullish Projection: 25,000–26,200 (subject to wave confirmation)
Trend Bias: Bullish, unless the current Elliott Wave structure is invalidated.
Professional View:
The broader structure continues to favour a bullish outlook, provided the current Elliott Wave count remains intact. While short-term volatility may persist during the completion of Wave 2, price action above key support levels would increase the probability of an impulsive advance toward higher resistance zones.
As always, confirmation through price action is more important than anticipation. Traders should monitor the validity of the wave structure and manage risk accordingly.
Disclaimer: This analysis reflects my personal interpretation of the market using Elliott Wave Theory and is shared strictly for educational purposes only. It should not be considered financial or investment advice.
"Don't predict the market. Decode it."
As discussed in my previous Mid-Term NIFTY Analysis (Weekly Chart published on 11 July 2026), the market continues to trade within Wave Y of Wave X of the larger Major Wave 4 corrective structure.
Within Wave Y, Wave A concluded at 24,601, and Wave B is currently unfolding.
Based on the latest price structure, Wave B appears to be developing as an ABC Irregular Correction.
The internal structure is currently interpreted as follows:
Internal Wave A of Wave B completed at 23,070.
Internal Wave B is currently unfolding.
Within this Internal Wave B:
Internal Wave A completed at 24,261.
Internal Wave B concluded at 23,805, by forming an Irregular Correction, as NIFTY moved below the 38.2% Fibonacci retracement level (23,972).
Consequently, Internal Wave C is now expected to be in progress.
What I'm Watching | 20 July – 24 July 2026
With the apparent completion of Internal Wave B within the ongoing corrective structure, the market may now be transitioning into Internal Wave C.
Within this wave:
Wave 1 appears to have completed at 24,134.
Wave 2 is currently in progress.
If this wave count remains valid, the completion of Wave 2 could pave the way for Wave 3, which is typically the strongest and most impulsive leg in an Elliott Wave sequence.
A sustained move above key resistance levels would strengthen the bullish case.
Key Levels to Watch
Immediate Resistance: 24,530
Major Resistance: 24,601
Bullish Projection: 25,000–26,200 (subject to wave confirmation)
Trend Bias: Bullish, unless the current Elliott Wave structure is invalidated.
Professional View:
The broader structure continues to favour a bullish outlook, provided the current Elliott Wave count remains intact. While short-term volatility may persist during the completion of Wave 2, price action above key support levels would increase the probability of an impulsive advance toward higher resistance zones.
As always, confirmation through price action is more important than anticipation. Traders should monitor the validity of the wave structure and manage risk accordingly.
Disclaimer: This analysis reflects my personal interpretation of the market using Elliott Wave Theory and is shared strictly for educational purposes only. It should not be considered financial or investment advice.
"Don't predict the market. Decode it."
Operación activa
24146-24117 is also a good support for the completion of Wave 2 that could pave the way for Wave 3.
Exención de responsabilidad
La información y las publicaciones no constituyen, ni deben considerarse como, asesoramiento o recomendaciones financieras, de inversión, de trading u otro tipo, proporcionadas o respaldadas por TradingView. Obtenga más información en Condiciones de uso.
Exención de responsabilidad
La información y las publicaciones no constituyen, ni deben considerarse como, asesoramiento o recomendaciones financieras, de inversión, de trading u otro tipo, proporcionadas o respaldadas por TradingView. Obtenga más información en Condiciones de uso.