
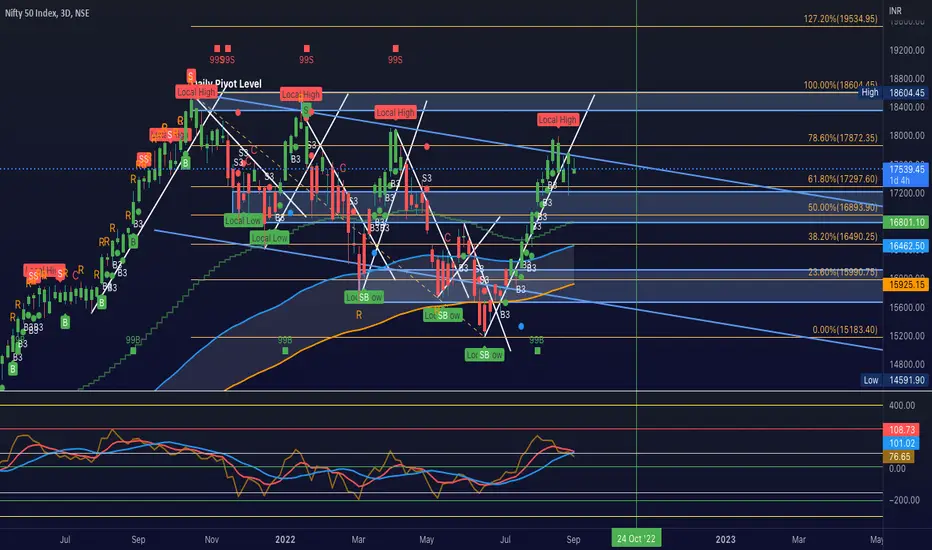
IN the following chart we have used indicators to show over bought and over sold regions, (not using RSI), and it seems that we have reached a Local High, and therefore there is possibility of downtrend, which also confirms with Falcon Wave counts.
There is possibility of 17100, 17000 levels, and we will have to see this week where price will go.

Falcon Wave Count for Nifty (Still early to say but looks like we have wave 3,4 and 5 pending in 1H

What is Kiss Bot Saying?

This looks like trigger line will break if market opens gap down.
There is possibility of 17100, 17000 levels, and we will have to see this week where price will go.
Falcon Wave Count for Nifty (Still early to say but looks like we have wave 3,4 and 5 pending in 1H
What is Kiss Bot Saying?
This looks like trigger line will break if market opens gap down.
Nota
Operación cerrada: objetivo alcanzado

Falcon Trader
Trading Courses charts-stocks.com
_________________________________
Ask for any script Falcon Wave count by DM
Twitter: @Falcon_Trader_1
Trading Courses charts-stocks.com
_________________________________
Ask for any script Falcon Wave count by DM
Twitter: @Falcon_Trader_1
Publicaciones relacionadas
Exención de responsabilidad
La información y las publicaciones no constituyen, ni deben considerarse como, asesoramiento o recomendaciones financieras, de inversión, de trading u otro tipo, proporcionadas o respaldadas por TradingView. Obtenga más información en Condiciones de uso.
Falcon Trader
Trading Courses charts-stocks.com
_________________________________
Ask for any script Falcon Wave count by DM
Twitter: @Falcon_Trader_1
Trading Courses charts-stocks.com
_________________________________
Ask for any script Falcon Wave count by DM
Twitter: @Falcon_Trader_1
Publicaciones relacionadas
Exención de responsabilidad
La información y las publicaciones no constituyen, ni deben considerarse como, asesoramiento o recomendaciones financieras, de inversión, de trading u otro tipo, proporcionadas o respaldadas por TradingView. Obtenga más información en Condiciones de uso.