 S&P CNX NIFTY INDEX FUTURESActualizado
 Nifty Tests Major Yearly Support — Next 3 Expiry Sessions Key
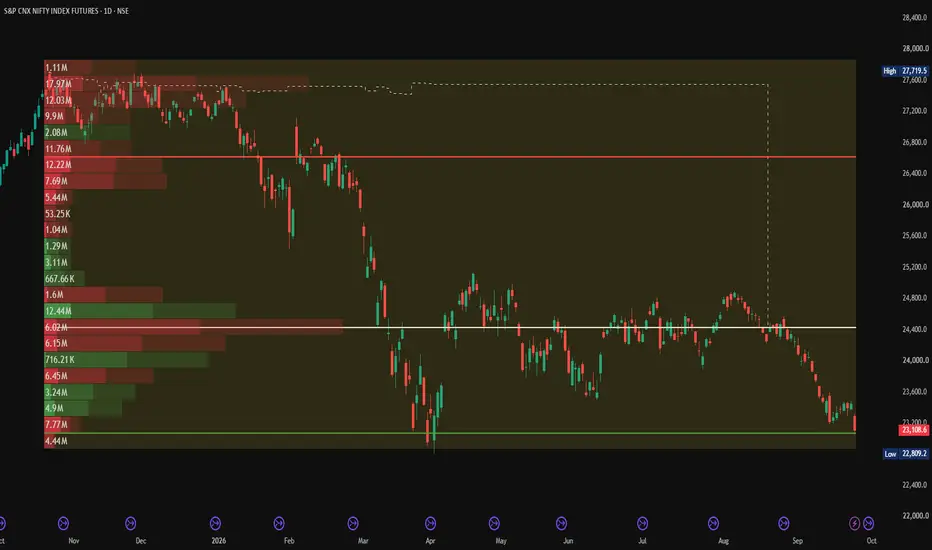
Nifty futures have fallen sharply into the last 3 sessions of September expiry, now trading near 23,108, down 341 points (-1.46%) today. Zooming out to the full one-year chart tells us something important: this isn't a fall into empty space — price is now testing a major long-term support zone that has held multiple times over the past year.
The Big Picture (1-Year View):
Looking at the volume profile from November 2025 to now, there's a clear support shelf sitting around 22,809–23,230 — this zone has attracted heavy trading activity in the past and has acted as a floor before. Compare that to where price fell from: the all-time high near 27,720, and the recent range high around 26,700. So while today's drop feels sharp in the short term, price is landing right on a level that has real trading history behind it — not just falling into thin air.
In simple terms:
Think of this support zone like a mattress that's caught the market's fall before. It doesn't guarantee a bounce, but it's a much more meaningful level to watch than a random number — because real buying and selling has happened here in the past.
Now, Zooming Into the Next 3 Expiry Sessions:
This is where the short-term delta view (buy vs. sell pressure) becomes useful. On the recent daily chart:
23,380–23,450 showed genuine buying pressure (green delta) even during sideways consolidation — this is the first real demand zone above current price
24,050–24,100 showed persistent selling pressure (red delta) — likely resistance if price attempts a bounce
Below current price, down toward the 22,809–23,230 major support, there's very little trading history in between — so a further slide could move quickly if this zone doesn't hold
What to watch over the next 3 sessions:
If price holds above the 22,809–23,230 major support zone → watch for a reclaim of 23,380–23,450 with renewed buying pressure as the first sign of a bounce, with 24,050–24,100 as the level that would need to be cleared next
If price breaks below 22,809 with strong selling pressure → this would mean the major yearly support has failed, and there's little historical trading data below to slow the next leg down
Bottom line:
Nifty is now testing one of its most important support zones of the past year, right into expiry. The next 3 sessions matter — either buyers defend this level (using 23,380–23,450 as the first confirmation), or a clean break below 22,809 opens the door to a deeper, faster move with little support in between.
This is for educational purposes only and not investment advice. Please do your own research or consult a financial advisor before making trading decisions.
The Big Picture (1-Year View):
Looking at the volume profile from November 2025 to now, there's a clear support shelf sitting around 22,809–23,230 — this zone has attracted heavy trading activity in the past and has acted as a floor before. Compare that to where price fell from: the all-time high near 27,720, and the recent range high around 26,700. So while today's drop feels sharp in the short term, price is landing right on a level that has real trading history behind it — not just falling into thin air.
In simple terms:
Think of this support zone like a mattress that's caught the market's fall before. It doesn't guarantee a bounce, but it's a much more meaningful level to watch than a random number — because real buying and selling has happened here in the past.
Now, Zooming Into the Next 3 Expiry Sessions:
This is where the short-term delta view (buy vs. sell pressure) becomes useful. On the recent daily chart:
23,380–23,450 showed genuine buying pressure (green delta) even during sideways consolidation — this is the first real demand zone above current price
24,050–24,100 showed persistent selling pressure (red delta) — likely resistance if price attempts a bounce
Below current price, down toward the 22,809–23,230 major support, there's very little trading history in between — so a further slide could move quickly if this zone doesn't hold
What to watch over the next 3 sessions:
If price holds above the 22,809–23,230 major support zone → watch for a reclaim of 23,380–23,450 with renewed buying pressure as the first sign of a bounce, with 24,050–24,100 as the level that would need to be cleared next
If price breaks below 22,809 with strong selling pressure → this would mean the major yearly support has failed, and there's little historical trading data below to slow the next leg down
Bottom line:
Nifty is now testing one of its most important support zones of the past year, right into expiry. The next 3 sessions matter — either buyers defend this level (using 23,380–23,450 as the first confirmation), or a clean break below 22,809 opens the door to a deeper, faster move with little support in between.
This is for educational purposes only and not investment advice. Please do your own research or consult a financial advisor before making trading decisions.
Operación cerrada: objetivo alcanzado
The major yearly support zone (22,809–23,230) has failed. Nifty closed the week at 22,421.95, down 718.55 points (-3.11%), with a low of 22,217.30 — well below the entire support zone flagged in this idea. The bullish reclaim scenario (23,380–23,450) was never triggered.As noted at the time, a break below 22,809 meant little historical support remained below — and that's now the case, with price approaching the 22,182 level from the shorter-term Fib extension. This idea is now closed.
This is for educational purposes only and not investment advice.

📈 HK Trading Community | Market Structure & Indicator Updates
Telegram: t.me/trendstrike1000
Website: quantumedgepro.netlify.app/
Real traders are built through learning,not tip hunting.So Start Learning How the Market Really Works
Telegram: t.me/trendstrike1000
Website: quantumedgepro.netlify.app/
Real traders are built through learning,not tip hunting.So Start Learning How the Market Really Works
Publicaciones relacionadas
Exención de responsabilidad
La información y las publicaciones no constituyen, ni deben considerarse como, asesoramiento o recomendaciones financieras, de inversión, de trading u otro tipo, proporcionadas o respaldadas por TradingView. Obtenga más información en Condiciones de uso.
📈 HK Trading Community | Market Structure & Indicator Updates
Telegram: t.me/trendstrike1000
Website: quantumedgepro.netlify.app/
Real traders are built through learning,not tip hunting.So Start Learning How the Market Really Works
Telegram: t.me/trendstrike1000
Website: quantumedgepro.netlify.app/
Real traders are built through learning,not tip hunting.So Start Learning How the Market Really Works
Publicaciones relacionadas
Exención de responsabilidad
La información y las publicaciones no constituyen, ni deben considerarse como, asesoramiento o recomendaciones financieras, de inversión, de trading u otro tipo, proporcionadas o respaldadas por TradingView. Obtenga más información en Condiciones de uso.