
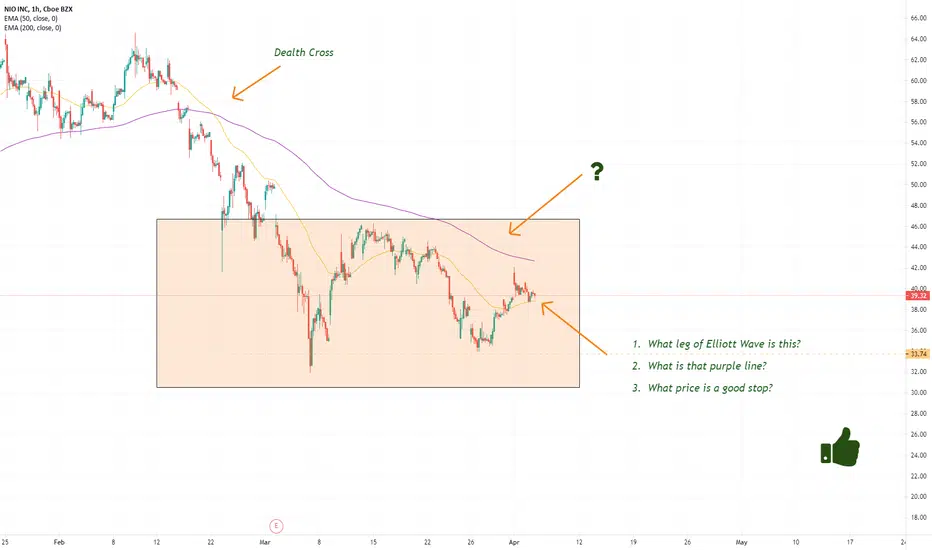
1. What leg of Elliott Wave is this? Double Bottom in Leg B
2. What is that purple line? Major Resistance
3. What price is a good stop? $33.74
Thank you for reading!
Greenfield
Starting April 19, for early access to my weekly chart price interpretation for cryptocurrency, gold, and a random stock, please subscribe to my YouTube.
youtube.com/channel/UC1uQWStOxAlA27PAuOdfZxw/videos
Disclosure: I am not a financial advisor. This is not a recommendation, not a representation, and not a solicitation. You should do your research and come to your own decision. Investment involves significant risks. You need to understand that you may lose your money. Past performance is not an indication of future performance. Chart reading is subjective information.

Publicaciones relacionadas
Exención de responsabilidad
La información y las publicaciones no constituyen, ni deben considerarse como, asesoramiento o recomendaciones financieras, de inversión, de trading u otro tipo, proporcionadas o respaldadas por TradingView. Obtenga más información en Condiciones de uso.