
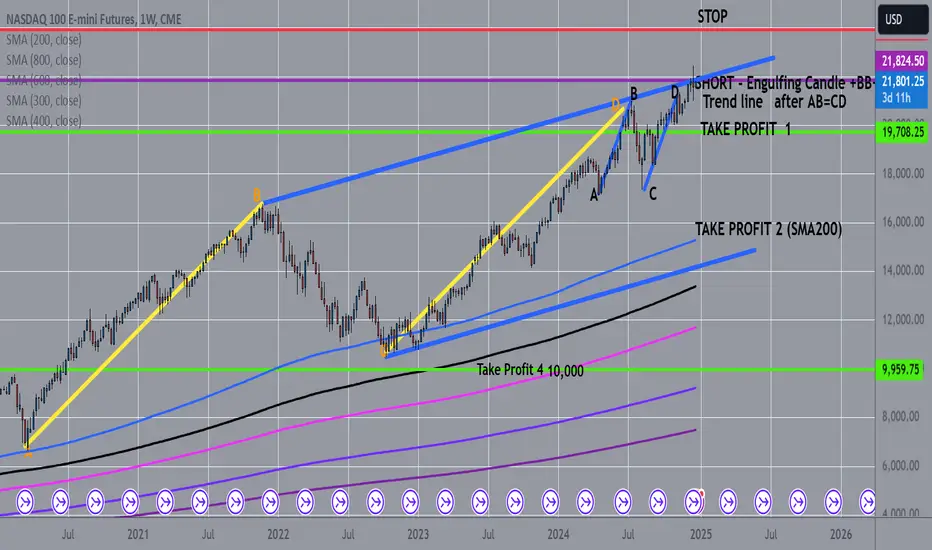
Nasdaq100 Short Weekly Chart, Price after big and small AB=CD + BB+ Trendline+ Engulfing candle at the top, price should go now to Take profit 1 area, and from there if will not be a real support it will go to test the SMA200, for take profit 2 odds are much more small but possible

Exención de responsabilidad
La información y las publicaciones no constituyen, ni deben considerarse como, asesoramiento o recomendaciones financieras, de inversión, de trading u otro tipo, proporcionadas o respaldadas por TradingView. Obtenga más información en Condiciones de uso.
Exención de responsabilidad
La información y las publicaciones no constituyen, ni deben considerarse como, asesoramiento o recomendaciones financieras, de inversión, de trading u otro tipo, proporcionadas o respaldadas por TradingView. Obtenga más información en Condiciones de uso.