
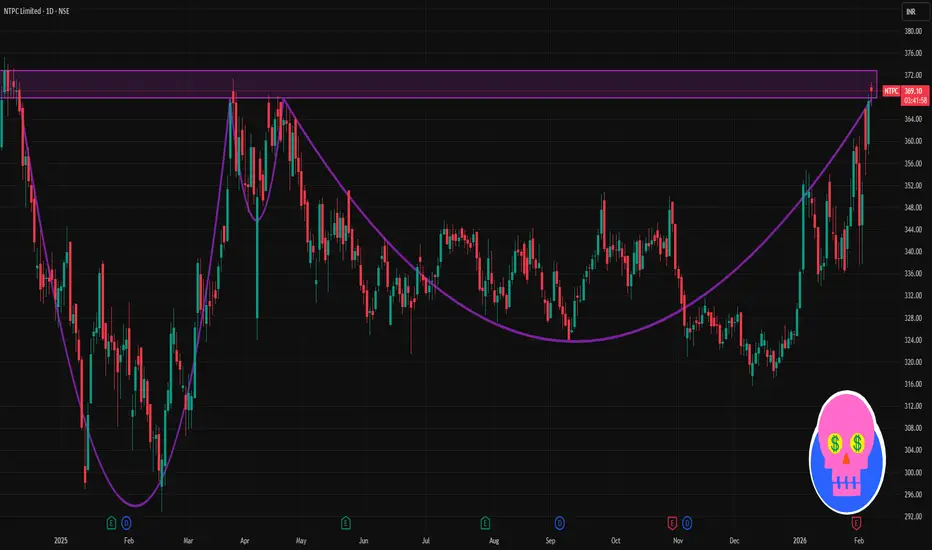
📌 Current Price (approx): ₹367–₹368 on NSE (today’s trading)
📊 Daily Pivot Levels (Key Reference Area)
These are calculated from recent price action & help identify where price may stall or bounce:
Central Pivot / CPR: ~₹364–₹365 (major reference)
Resistance (Upside Levels):
R1: ~₹371
R2: ~₹375
R3: ~₹382+
Support (Downside Levels):
S1: ~₹360
S2: ~₹353
S3: ~₹349
(Standard pivot model)
Daily EMA/SMA key zones:
20-day EMA ~₹347
50-day SMA ~₹339
100/200 day ~₹336-338
(These averages act as dynamic support/resistance)
🚀 Price Action Levels
📌 Immediate Resistance
First upside test: ₹370–₹372
Secondary upside: ₹375–₹378
Breakout zone: above ₹380 (short-term bullish continuation)
📉 Immediate Support
First support: ₹360–₹362
Next support: ₹353–₹355
Deeper support: ₹348–₹350
If price holds above pivot (~364–365) → short-term bullish bias. If it breaks below S1 (~360) → watch S2/S3 zones for stronger supports.
📈 Trend Context (Daily)
✔ Current price is trading above key medium-term moving averages (20/50/100/200 day), signalling bullish trend on daily charts.
✔ RSI levels and momentum indicators generally are neutral to slightly bullish — suggesting strength near current price zone but watch for overbought conditions.
How to use these levels
🔹 Bullish view (long positions):
– Entry if price breaks and holds above R1 (~₹371)
– Targets near R2 (~₹375) and R3 (~₹382+)
– Stop-loss below pivot (~₹364)
🔹 Bearish view (short positions or pullback):
– Look for rejection near R1/R2
– First target near S1 (~₹360)
– Deeper bearish target near S2 (~₹353)

Contact Knowledgehub for a detailed consultation: Dm on WhatsApp: [wa.link/a2o0kz]-
Phone No: [+91 93102 26243]-
Email: [tradingviewknowledgehub@gmail.com]---
-- Let’s achieve success together!
Phone No: [+91 93102 26243]-
Email: [tradingviewknowledgehub@gmail.com]---
-- Let’s achieve success together!
Publicaciones relacionadas
Exención de responsabilidad
La información y las publicaciones no constituyen, ni deben considerarse como, asesoramiento o recomendaciones financieras, de inversión, de trading u otro tipo, proporcionadas o respaldadas por TradingView. Obtenga más información en Condiciones de uso.