It’s a rarity for a week to go by in financial markets without technology stocks that dominate the US 100 index, grabbing the headlines in some form and it seems that this week is no exception. Sentiment and prices dipped early on Monday after Alibaba raised $10 billion in Hong Kong’s biggest ever secondary share sale to help fund its goal of being a global AI leader. This brought back concerns about the size of AI capital expenditure to the fore which saw chipmakers within the US 100 fall and led the index to drop from its initial highs around 29404 down to a low of 28873 before some dip buying stemmed the decline.
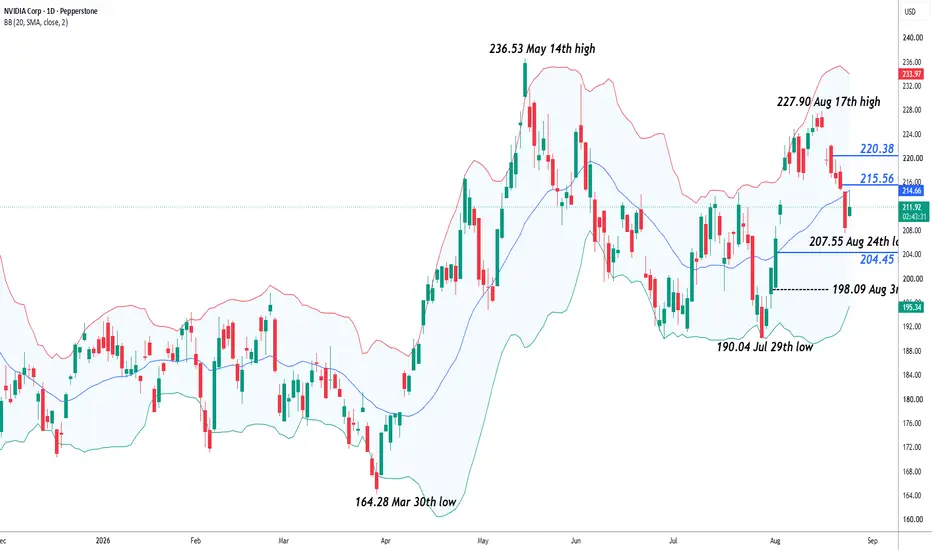
Traders are already on edge this week as it is, with Nvidia, the AI bellwether and world’s most valuable company, due to release its latest results after the close on Wednesday. Nvidia carries the biggest weighting in the US 100 and option markets are currently pricing in the chance of a 4.6% move in the stock post results according to Bloomberg, a move that if it happened could have a significant impact on US 100 index volatility.
Not only that but traders are also monitoring the response from Iran to the US switching its approach from missile strikes to a strategy of economic isolation to potentially bring some form of resolution to the Middle East conflict. How Tehran responds could also be an important factor influencing sentiment towards US indices.
Then finally on Friday, Fed Chair Kevin Warsh is due to deliver his keynote speech from the Fed’s Jackson Hole Symposium at 1500 BST. US 100 traders may be influenced by his views on US government finances, surging bond yields and central bank independence. Any updates he provides on interest rate policy could also be of pivotal importance given the uncertainty about what US policymakers may decide when they next meet on September 16th.
Technical Update: 29039 The First Key Support Focus?
While the period of price strength seen in the US 100 index between the July 29th low at 27050 and the August 17th high of 30246 was an impressive move, it appears the upside momentum may have failed against a potentially strong resistance band from which price weakness emerged last week.

This resistance band stands between 30246 all the way up to 30776 and equates to a series of previous failure highs posted between June 3rd and August 17th. Traders may view this series of highs as a strong barrier to further upside and could well be an important resistance area to monitor.
On the downside, the first key support focus could be 29039. This level is equal to the 38.2% Fibonacci retracement of the July 29th to August 17th strength. While this level was tested on Monday, it held on a closing basis, adding to its potential as an important support to watch in the short term.
Potential Resistance Levels:
While the previous cluster of highs between 30246 and 30776 may be the key resistance range, there could be a lower level for traders to monitor at 29580 which is equal to half of the latest decline. Closing breaks above 29580 could increase potential for a more sustained retest of the August 17th peak at 30246, possibly higher.
However, as outlined earlier in the technical update, for upside momentum to be reestablished it may take closes above the June 3rd high at 30776 to confirm potential for further gains toward 32212 (38.2% Fibonacci extension of the June 3rd to July 29th decline), then 33102 (61.8% extension).
Potential Support Levels:
Currently, the first potential support level at 29039 (38.2% retracement) is still holding the current phase of weakness and closes below this level may be necessary to indicate that risks are turning toward renewed declines.
Closing breaks below 29039 could lead to further downside momentum, opening scope toward 28551 (50% retracement), and then possibly the deeper 61.8% retracement at 28255.
The material provided here has not been prepared accordance with legal requirements designed to promote the independence of investment research and as such is considered to be a marketing communication. Whilst it is not subject to any prohibition on dealing ahead of the dissemination of investment research, we will not seek to take any advantage before providing it to our clients.
Pepperstone doesn’t represent that the material provided here is accurate, current or complete, and therefore shouldn’t be relied upon as such. The information, whether from a third party or not, isn’t to be considered as a recommendation; or an offer to buy or sell; or the solicitation of an offer to buy or sell any security, financial product or instrument; or to participate in any particular trading strategy. It does not take into account readers’ financial situation or investment objectives. We advise any readers of this content to seek their own advice. Without the approval of Pepperstone, reproduction or redistribution of this information isn’t permitted.
Traders are already on edge this week as it is, with Nvidia, the AI bellwether and world’s most valuable company, due to release its latest results after the close on Wednesday. Nvidia carries the biggest weighting in the US 100 and option markets are currently pricing in the chance of a 4.6% move in the stock post results according to Bloomberg, a move that if it happened could have a significant impact on US 100 index volatility.
Not only that but traders are also monitoring the response from Iran to the US switching its approach from missile strikes to a strategy of economic isolation to potentially bring some form of resolution to the Middle East conflict. How Tehran responds could also be an important factor influencing sentiment towards US indices.
Then finally on Friday, Fed Chair Kevin Warsh is due to deliver his keynote speech from the Fed’s Jackson Hole Symposium at 1500 BST. US 100 traders may be influenced by his views on US government finances, surging bond yields and central bank independence. Any updates he provides on interest rate policy could also be of pivotal importance given the uncertainty about what US policymakers may decide when they next meet on September 16th.
Technical Update: 29039 The First Key Support Focus?
While the period of price strength seen in the US 100 index between the July 29th low at 27050 and the August 17th high of 30246 was an impressive move, it appears the upside momentum may have failed against a potentially strong resistance band from which price weakness emerged last week.
This resistance band stands between 30246 all the way up to 30776 and equates to a series of previous failure highs posted between June 3rd and August 17th. Traders may view this series of highs as a strong barrier to further upside and could well be an important resistance area to monitor.
On the downside, the first key support focus could be 29039. This level is equal to the 38.2% Fibonacci retracement of the July 29th to August 17th strength. While this level was tested on Monday, it held on a closing basis, adding to its potential as an important support to watch in the short term.
Potential Resistance Levels:
While the previous cluster of highs between 30246 and 30776 may be the key resistance range, there could be a lower level for traders to monitor at 29580 which is equal to half of the latest decline. Closing breaks above 29580 could increase potential for a more sustained retest of the August 17th peak at 30246, possibly higher.
However, as outlined earlier in the technical update, for upside momentum to be reestablished it may take closes above the June 3rd high at 30776 to confirm potential for further gains toward 32212 (38.2% Fibonacci extension of the June 3rd to July 29th decline), then 33102 (61.8% extension).
Potential Support Levels:
Currently, the first potential support level at 29039 (38.2% retracement) is still holding the current phase of weakness and closes below this level may be necessary to indicate that risks are turning toward renewed declines.
Closing breaks below 29039 could lead to further downside momentum, opening scope toward 28551 (50% retracement), and then possibly the deeper 61.8% retracement at 28255.
The material provided here has not been prepared accordance with legal requirements designed to promote the independence of investment research and as such is considered to be a marketing communication. Whilst it is not subject to any prohibition on dealing ahead of the dissemination of investment research, we will not seek to take any advantage before providing it to our clients.
Pepperstone doesn’t represent that the material provided here is accurate, current or complete, and therefore shouldn’t be relied upon as such. The information, whether from a third party or not, isn’t to be considered as a recommendation; or an offer to buy or sell; or the solicitation of an offer to buy or sell any security, financial product or instrument; or to participate in any particular trading strategy. It does not take into account readers’ financial situation or investment objectives. We advise any readers of this content to seek their own advice. Without the approval of Pepperstone, reproduction or redistribution of this information isn’t permitted.

Global risk Warning CFDs are complex instruments and come with a high risk of losing money rapidly due to leverage. Between 74-89% of retail investor accounts lose money when trading in CFDs. You should consider whether you understand how CFD
Exención de responsabilidad
La información y las publicaciones no constituyen, ni deben considerarse como, asesoramiento o recomendaciones financieras, de inversión, de trading u otro tipo, proporcionadas o respaldadas por TradingView. Obtenga más información en Condiciones de uso.
Global risk Warning CFDs are complex instruments and come with a high risk of losing money rapidly due to leverage. Between 74-89% of retail investor accounts lose money when trading in CFDs. You should consider whether you understand how CFD
Exención de responsabilidad
La información y las publicaciones no constituyen, ni deben considerarse como, asesoramiento o recomendaciones financieras, de inversión, de trading u otro tipo, proporcionadas o respaldadas por TradingView. Obtenga más información en Condiciones de uso.