
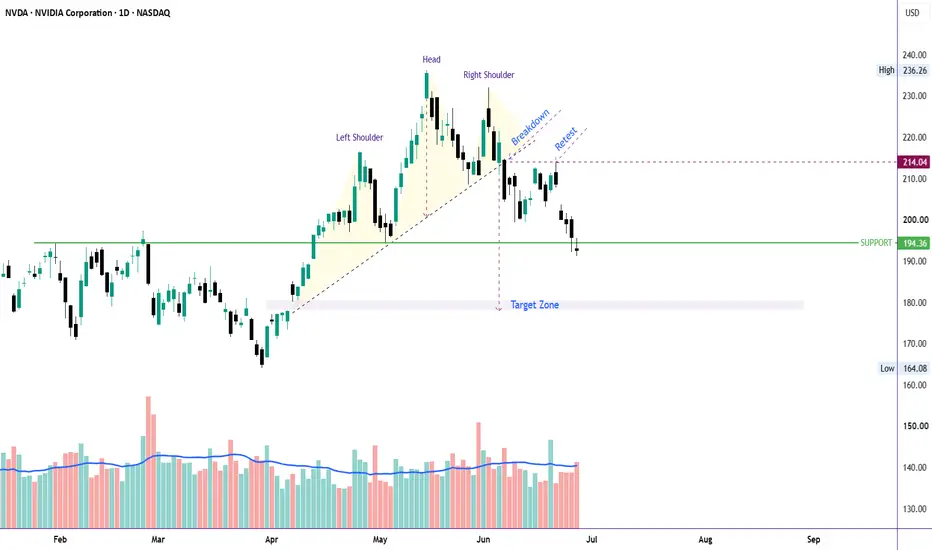
NVDA has confirmed a bearish technical breakdown after retesting the neckline of a previously broken Inverse Head & Shoulders and failing to reclaim it. Adding to the weakness, the stock has now broken below the major 194 support on strong volume, signaling increasing selling pressure.
Key Technical Observations:
📉 Failed retest of the Inverse Head & Shoulders breakout level, turning former support into resistance.
🔻 Decisive breakdown below the key 194 support with strong volume, confirming bearish momentum.
🎯 The next downside target lies around 178–180, where the stock may find temporary support.
⚠️ If selling pressure continues, a deeper correction cannot be ruled out.
Unless buyers quickly regain control, rallies are likely to be short-lived and corrective in nature.
Bullish Invalidation
This bearish thesis would be invalidated by a strong daily close above 215, which would indicate that buyers have reclaimed key resistance and the breakdown was likely a false move.
Until then, the technical outlook favors further downside, with 178–180 as the first key target.

📊 Charts → 🏗️ Structure → 🎯 Probability =📖 Chart Story
⏳ Patience → 🚀Success
🎯 If this setup makes sense to you, show it some support with a Boost.
⏳ Patience → 🚀Success
🎯 If this setup makes sense to you, show it some support with a Boost.
Exención de responsabilidad
La información y las publicaciones no constituyen, ni deben considerarse como, asesoramiento o recomendaciones financieras, de inversión, de trading u otro tipo, proporcionadas o respaldadas por TradingView. Obtenga más información en Condiciones de uso.