
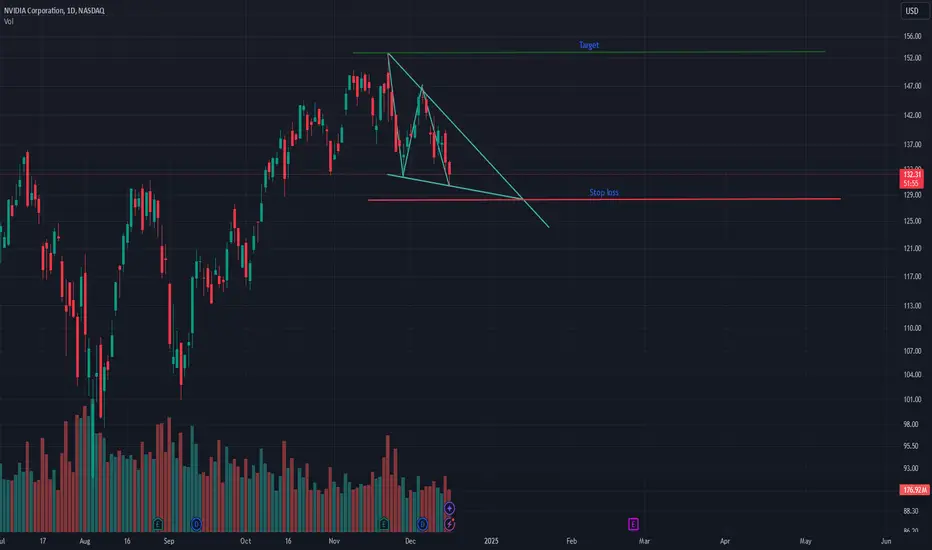
A falling wedge pattern has formed on NVDA's daily chart, with price action contained between two converging downward trendlines. The stock shows a potential bullish reversal setup after reaching recent highs around $145. Volume has been declining during the pattern formation, which is characteristic of a falling wedge. The setup offers a clear risk-reward with stop loss at $127 and target at $153, with entry planned on a break above the upper trendline.

Exención de responsabilidad
La información y las publicaciones no constituyen, ni deben considerarse como, asesoramiento o recomendaciones financieras, de inversión, de trading u otro tipo, proporcionadas o respaldadas por TradingView. Obtenga más información en Condiciones de uso.
Exención de responsabilidad
La información y las publicaciones no constituyen, ni deben considerarse como, asesoramiento o recomendaciones financieras, de inversión, de trading u otro tipo, proporcionadas o respaldadas por TradingView. Obtenga más información en Condiciones de uso.