

NZD/CHF — 1HR DEMAND LEVEL AFTER LIQUIDITY - 30MIN CHOCH CONFIRM
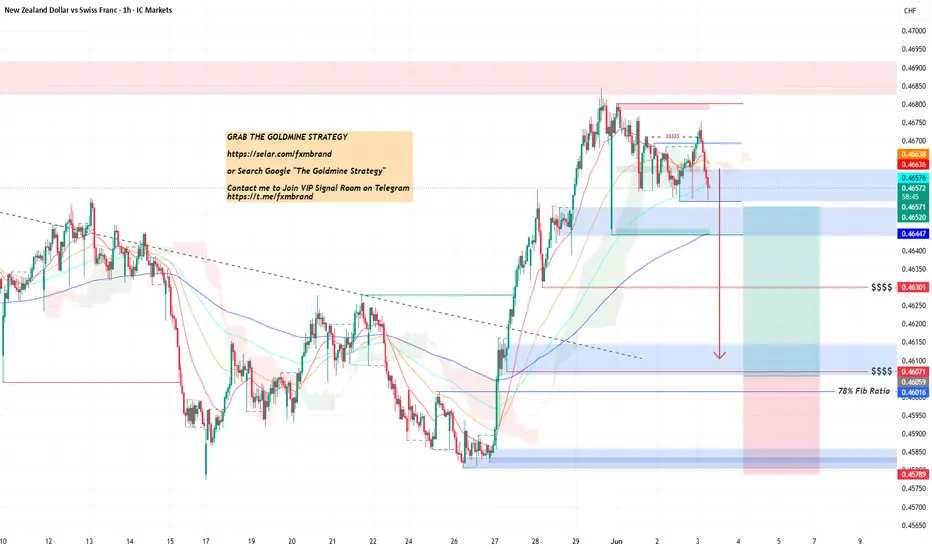
The prior short from 0.4680 supply has delivered price precisely to the 78% Fibonacci retracement demand zone at 0.46016 — explicitly labelled on the chart. This is where the buy triggers. Three confluences stack at the same level simultaneously: the 78% Fib ratio, the ascending dashed trendline (higher lows from May), and the $$$$ institutional buy cluster. The sell was the vehicle; the buy is the primary trade.
Entry: 0.46016–0.46552 — 78% Fib demand / $$$$ zone (scale in)
Stop Loss: 0.45789 — below demand floor and trendline
TP1: 0.46301 — $$$$ midpoint liquidity
TP2: 0.46641 — $$$$ supply cluster (prior rejection zone)
TP3: 0.46800+ — macro pink supply ceiling
Risk/Reward: ~3.5R to TP2 | extends to ~5R+ at TP3
Confluences:
78% Fib Ratio demand — chart labelled explicitly as key level
Ascending trendline providing dynamic support right at entry
$$$$ institutional buy cluster overlapping with Fib level
Large blue macro demand block as the structural base
Prior sell fully completed — buy is the next cycle leg
Two stacked $$$$ liquidity pools above as sequential targets
Entry execution: 50% at current price (0.4655), 50% on any dip to 0.4601–0.4607 floor. SL below 0.45789.
Invalidation: 1H close below 0.45789 = demand failed, trendline broken. Step aside.
The Goldmine Framework In Action
This chart demonstrates one of the core concepts I use when analyzing market structure.
Rather than chasing every move, I focus on:
• Liquidity creation
• Market structure shifts
• Imbalances
• Premium and discount pricing
The objective is to identify where institutions are most likely to engage rather than where retail traders are reacting.
Markets become significantly easier to read when you stop asking:
"Where is price now?"
and start asking:
"Where does price need to go next?"
I shared the full scale strategy on The Institutional Fx Code in The Goldmine Trading Arsenal Package. Just search Google "The Goldmine Trading Arsenal"
Entry: 0.46016–0.46552 — 78% Fib demand / $$$$ zone (scale in)
Stop Loss: 0.45789 — below demand floor and trendline
TP1: 0.46301 — $$$$ midpoint liquidity
TP2: 0.46641 — $$$$ supply cluster (prior rejection zone)
TP3: 0.46800+ — macro pink supply ceiling
Risk/Reward: ~3.5R to TP2 | extends to ~5R+ at TP3
Confluences:
78% Fib Ratio demand — chart labelled explicitly as key level
Ascending trendline providing dynamic support right at entry
$$$$ institutional buy cluster overlapping with Fib level
Large blue macro demand block as the structural base
Prior sell fully completed — buy is the next cycle leg
Two stacked $$$$ liquidity pools above as sequential targets
Entry execution: 50% at current price (0.4655), 50% on any dip to 0.4601–0.4607 floor. SL below 0.45789.
Invalidation: 1H close below 0.45789 = demand failed, trendline broken. Step aside.
The Goldmine Framework In Action
This chart demonstrates one of the core concepts I use when analyzing market structure.
Rather than chasing every move, I focus on:
• Liquidity creation
• Market structure shifts
• Imbalances
• Premium and discount pricing
The objective is to identify where institutions are most likely to engage rather than where retail traders are reacting.
Markets become significantly easier to read when you stop asking:
"Where is price now?"
and start asking:
"Where does price need to go next?"
I shared the full scale strategy on The Institutional Fx Code in The Goldmine Trading Arsenal Package. Just search Google "The Goldmine Trading Arsenal"

Publicaciones relacionadas
Exención de responsabilidad
La información y las publicaciones no constituyen, ni deben considerarse como, asesoramiento o recomendaciones financieras, de inversión, de trading u otro tipo, proporcionadas o respaldadas por TradingView. Obtenga más información en Condiciones de uso.
Publicaciones relacionadas
Exención de responsabilidad
La información y las publicaciones no constituyen, ni deben considerarse como, asesoramiento o recomendaciones financieras, de inversión, de trading u otro tipo, proporcionadas o respaldadas por TradingView. Obtenga más información en Condiciones de uso.