Largo
OGN Price Prediction
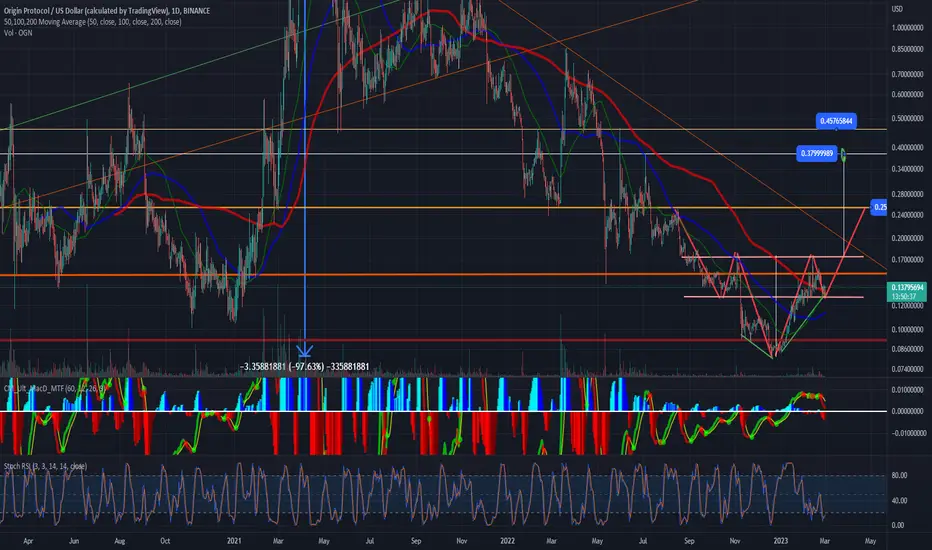
OGN price, forming reversal head and shoulder pattern, which the formation it might ends in the middle of march.
Then we can see, bounce from the lows of 0.13 cents until 0.25 cents for the begining of an upside leg.
If we stay above the 0.25 cents as support, we then can see more upside legs froming until 0.37 ~ 0.45 as you can see in the chart.
RSI remaining fro the time being, near oversold area.
This can be good time to buy!
Then we can see, bounce from the lows of 0.13 cents until 0.25 cents for the begining of an upside leg.
If we stay above the 0.25 cents as support, we then can see more upside legs froming until 0.37 ~ 0.45 as you can see in the chart.
RSI remaining fro the time being, near oversold area.
This can be good time to buy!

Exención de responsabilidad
La información y las publicaciones no constituyen, ni deben considerarse como, asesoramiento o recomendaciones financieras, de inversión, de trading u otro tipo, proporcionadas o respaldadas por TradingView. Obtenga más información en Condiciones de uso.
Exención de responsabilidad
La información y las publicaciones no constituyen, ni deben considerarse como, asesoramiento o recomendaciones financieras, de inversión, de trading u otro tipo, proporcionadas o respaldadas por TradingView. Obtenga más información en Condiciones de uso.