
📌 Chart Structure Overview
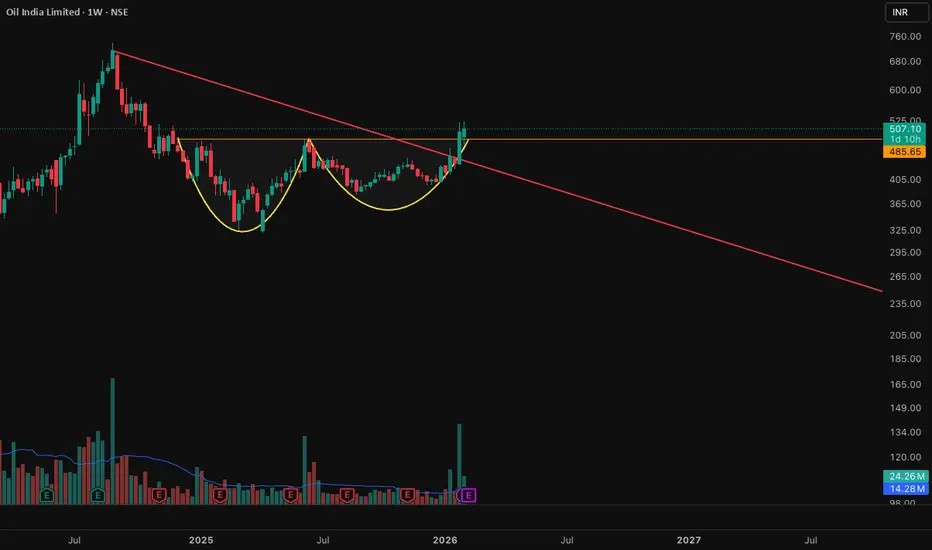
Oil India has broken out above a long-term descending trendline on the weekly timeframe. The breakout is supported by a rounding bottom / cup-like structure, indicating gradual accumulation and a potential trend reversal from corrective to bullish.
Price has also reclaimed a key horizontal resistance zone, turning it into support — a positive sign for continuation.
📈 Resistance Levels
₹530 – ₹540: Immediate resistance zone (recent swing high / breakout test area)
₹600: Psychological and structural resistance
₹680 – ₹720: Major supply zone near previous all-time high region
📉 Support Levels
₹485 – ₹490: Strong breakout retest zone (must hold for bullish continuation)
₹450: Intermediate support and neckline area
₹400 – ₹410: Major weekly demand zone (structure invalidation below this)
🔍 Technical Observations
Pattern: Rounding Bottom + Descending Trendline Breakout
Trend: Weekly trend shifting from corrective to bullish
Volume: Expansion visible near breakout, confirming participation
Price Action: Higher lows formation after long consolidation
🎯 Bullish & Bearish Scenarios
✅ Bullish Case
Sustained weekly close above ₹485
Upside targets: ₹600 → ₹680 → ₹720
❌ Bearish Case
Failure to hold ₹450
Breakdown below ₹400 invalidates bullish structure
📘 Trading Notes
Suitable for swing traders & positional traders
Best entries on pullbacks toward breakout support
Risk management essential due to prior volatility
⚠️ Disclaimer
This analysis is for educational purposes only. Not financial advice.
Oil India has broken out above a long-term descending trendline on the weekly timeframe. The breakout is supported by a rounding bottom / cup-like structure, indicating gradual accumulation and a potential trend reversal from corrective to bullish.
Price has also reclaimed a key horizontal resistance zone, turning it into support — a positive sign for continuation.
📈 Resistance Levels
₹530 – ₹540: Immediate resistance zone (recent swing high / breakout test area)
₹600: Psychological and structural resistance
₹680 – ₹720: Major supply zone near previous all-time high region
📉 Support Levels
₹485 – ₹490: Strong breakout retest zone (must hold for bullish continuation)
₹450: Intermediate support and neckline area
₹400 – ₹410: Major weekly demand zone (structure invalidation below this)
🔍 Technical Observations
Pattern: Rounding Bottom + Descending Trendline Breakout
Trend: Weekly trend shifting from corrective to bullish
Volume: Expansion visible near breakout, confirming participation
Price Action: Higher lows formation after long consolidation
🎯 Bullish & Bearish Scenarios
✅ Bullish Case
Sustained weekly close above ₹485
Upside targets: ₹600 → ₹680 → ₹720
❌ Bearish Case
Failure to hold ₹450
Breakdown below ₹400 invalidates bullish structure
📘 Trading Notes
Suitable for swing traders & positional traders
Best entries on pullbacks toward breakout support
Risk management essential due to prior volatility
⚠️ Disclaimer
This analysis is for educational purposes only. Not financial advice.

Exención de responsabilidad
La información y las publicaciones no constituyen, ni deben considerarse como, asesoramiento o recomendaciones financieras, de inversión, de trading u otro tipo, proporcionadas o respaldadas por TradingView. Obtenga más información en Condiciones de uso.
Exención de responsabilidad
La información y las publicaciones no constituyen, ni deben considerarse como, asesoramiento o recomendaciones financieras, de inversión, de trading u otro tipo, proporcionadas o respaldadas por TradingView. Obtenga más información en Condiciones de uso.