
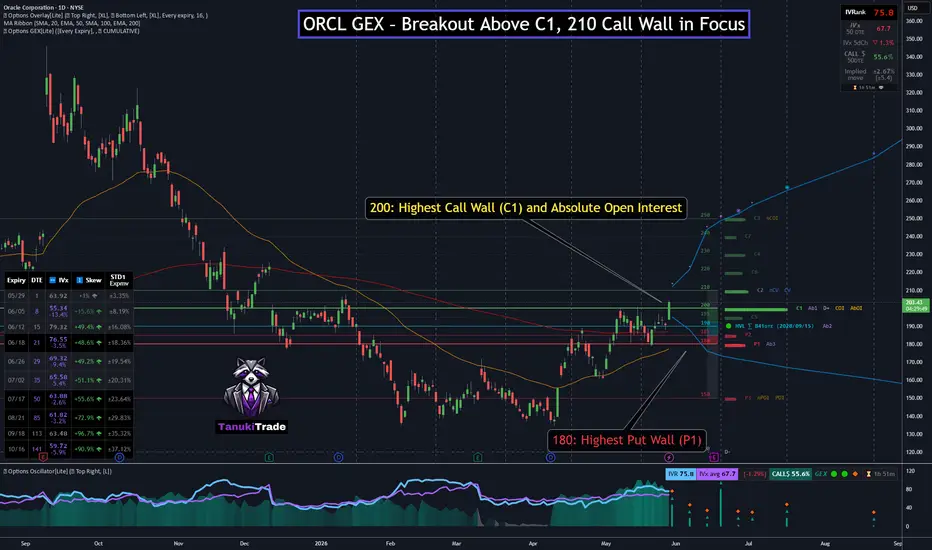
ORCL is showing a strong momentum breakout on the daily chart, clearing 200 – C1 on a wide-range green candle after weeks of compression below the highest call NETGEX wall.
Price is now above 190 – HVL, inside a positive GEX regime, with gamma squeeze potential open toward 210 – C2 in the positive extension zone.
🔶 Regime Context 🔶
Price is trading above 190 – HVL, keeping ORCL in a positive GEX regime — typically more controlled price action than below the gamma flip.
This is a GEX structure / momentum breakout, not an earnings-day setup.
🔶 Options Structure Context 🔶
👉 210 – C2 — next major call wall; first decision point inside the extension zone
👉 200 – C1 — highest call NETGEX wall, cleared on today's move; must hold on retest as breakout support
With C1 cleared, price has entered the positive gamma extension zone — gamma squeeze potential toward 210 (C2) if acceptance holds.
👉 250 – C3 — longer-term extension reference above 210
Price is pressing the 200 SMA (~207) from below while holding above the 50 SMA (~170).
🔶 Downside Structure 🔶
👉 190 – HVL — regime pivot; failure shifts structure back toward transition
👉 185 – P2 — secondary put wall
👉 180 – P1 — strongest put wall below
👉 150 – P3 — major put floor
🔶 Options Sentiment 🔶
CALL$ 55.6% means call options at an equivalent distance from spot are priced 55.6% higher than the corresponding puts — this is call pricing skew, and calls remain premium-rich at current levels.
On the Options Oscillator, the filled green histogram has faded from its recent local peak at the right edge — call pricing skew is not building with this breakout; it is easing off the highs, well below the larger peaks from earlier in the year.
The key question is whether price can accept above 210 (C2) — or whether 200–210 stalls and pulls price back toward 190 (HVL) support.
Price is now above 190 – HVL, inside a positive GEX regime, with gamma squeeze potential open toward 210 – C2 in the positive extension zone.
🔶 Regime Context 🔶
Price is trading above 190 – HVL, keeping ORCL in a positive GEX regime — typically more controlled price action than below the gamma flip.
This is a GEX structure / momentum breakout, not an earnings-day setup.
🔶 Options Structure Context 🔶
👉 210 – C2 — next major call wall; first decision point inside the extension zone
👉 200 – C1 — highest call NETGEX wall, cleared on today's move; must hold on retest as breakout support
With C1 cleared, price has entered the positive gamma extension zone — gamma squeeze potential toward 210 (C2) if acceptance holds.
👉 250 – C3 — longer-term extension reference above 210
Price is pressing the 200 SMA (~207) from below while holding above the 50 SMA (~170).
🔶 Downside Structure 🔶
👉 190 – HVL — regime pivot; failure shifts structure back toward transition
👉 185 – P2 — secondary put wall
👉 180 – P1 — strongest put wall below
👉 150 – P3 — major put floor
🔶 Options Sentiment 🔶
CALL$ 55.6% means call options at an equivalent distance from spot are priced 55.6% higher than the corresponding puts — this is call pricing skew, and calls remain premium-rich at current levels.
On the Options Oscillator, the filled green histogram has faded from its recent local peak at the right edge — call pricing skew is not building with this breakout; it is easing off the highs, well below the larger peaks from earlier in the year.
- IVRank 75.8
- IVx 67.7 | IVx 5dCh -1.3%
- CALL$ 55.6% — call pricing skew
- Implied move ±2.68% (±5.4)
- 210 (C2) — extension target; continuation vs. rejection
- 200 (C1) — cleared breakout level; must hold on retest
- 207 (200 SMA) — technical overhead inside the C1→C2 corridor
- 190 (HVL) — regime pivot; failure opens retest toward 185–180
The key question is whether price can accept above 210 (C2) — or whether 200–210 stalls and pulls price back toward 190 (HVL) support.

Boost up your charts with Options PRO!
REAL Options metrics for over 250+ liquid US symbols:
✔ 𝗔𝘂𝘁𝗼-𝗨𝗽𝗱𝗮𝘁𝗶𝗻𝗴 𝗚𝗘𝗫 𝗹𝗲𝘃𝗲𝗹𝘀
✔ GEX ✔ IVRank ✔ CALL/PUT skew ✔ Volatility✔ Delta curves
👉 7-day FREE TRIAL 🌐 TanukiTrade.com
REAL Options metrics for over 250+ liquid US symbols:
✔ 𝗔𝘂𝘁𝗼-𝗨𝗽𝗱𝗮𝘁𝗶𝗻𝗴 𝗚𝗘𝗫 𝗹𝗲𝘃𝗲𝗹𝘀
✔ GEX ✔ IVRank ✔ CALL/PUT skew ✔ Volatility✔ Delta curves
👉 7-day FREE TRIAL 🌐 TanukiTrade.com
Publicaciones relacionadas
Exención de responsabilidad
La información y las publicaciones no constituyen, ni deben considerarse como, asesoramiento o recomendaciones financieras, de inversión, de trading u otro tipo, proporcionadas o respaldadas por TradingView. Obtenga más información en Condiciones de uso.
Boost up your charts with Options PRO!
REAL Options metrics for over 250+ liquid US symbols:
✔ 𝗔𝘂𝘁𝗼-𝗨𝗽𝗱𝗮𝘁𝗶𝗻𝗴 𝗚𝗘𝗫 𝗹𝗲𝘃𝗲𝗹𝘀
✔ GEX ✔ IVRank ✔ CALL/PUT skew ✔ Volatility✔ Delta curves
👉 7-day FREE TRIAL 🌐 TanukiTrade.com
REAL Options metrics for over 250+ liquid US symbols:
✔ 𝗔𝘂𝘁𝗼-𝗨𝗽𝗱𝗮𝘁𝗶𝗻𝗴 𝗚𝗘𝗫 𝗹𝗲𝘃𝗲𝗹𝘀
✔ GEX ✔ IVRank ✔ CALL/PUT skew ✔ Volatility✔ Delta curves
👉 7-day FREE TRIAL 🌐 TanukiTrade.com
Publicaciones relacionadas
Exención de responsabilidad
La información y las publicaciones no constituyen, ni deben considerarse como, asesoramiento o recomendaciones financieras, de inversión, de trading u otro tipo, proporcionadas o respaldadas por TradingView. Obtenga más información en Condiciones de uso.