
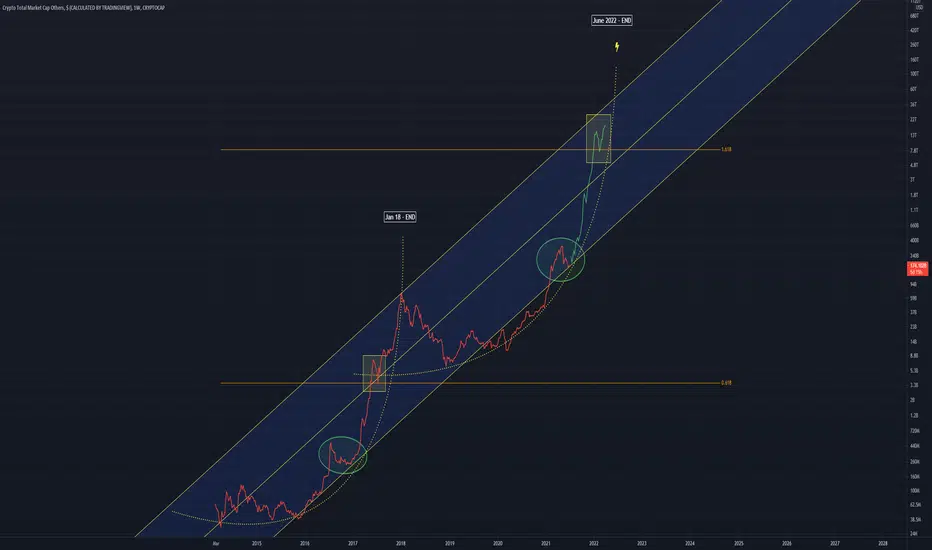
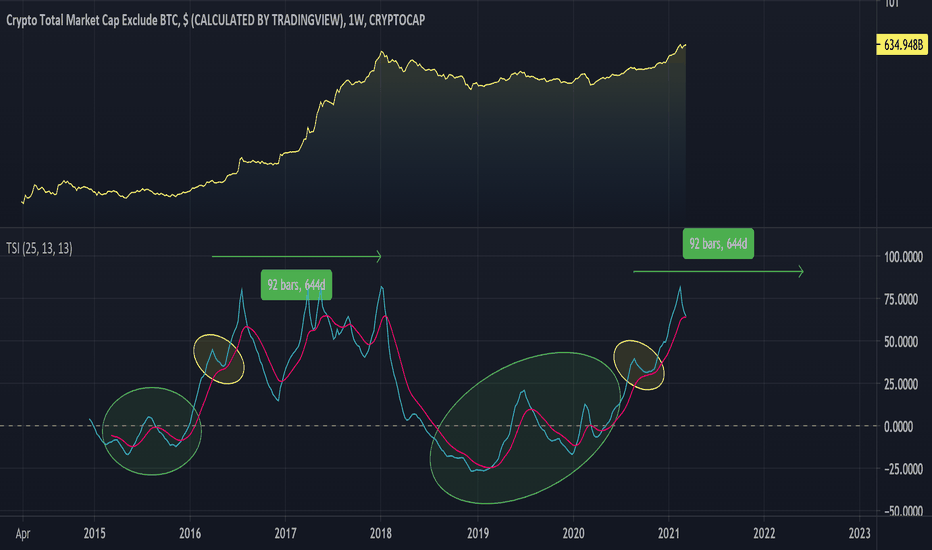
Many of my charts are suggesting a June 2022 end to the bull market
Similar price points can be seen at .618 and 1.618
The curved pattern is pretty cool to observe, I wonder if it will continue further upwards
We are currently in the green circle, a pullback after a bull run, preparing us for the bigger second phase bull run, which is plotted after the green circle
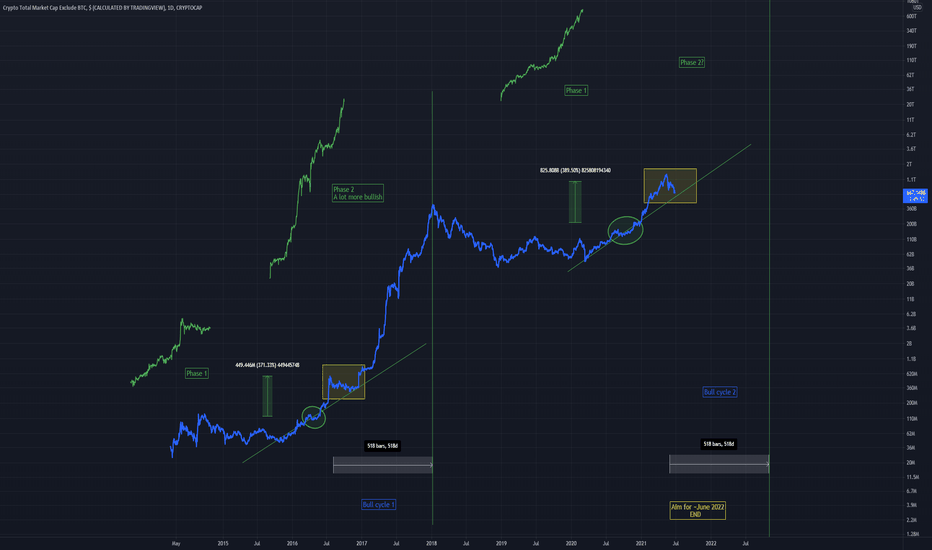
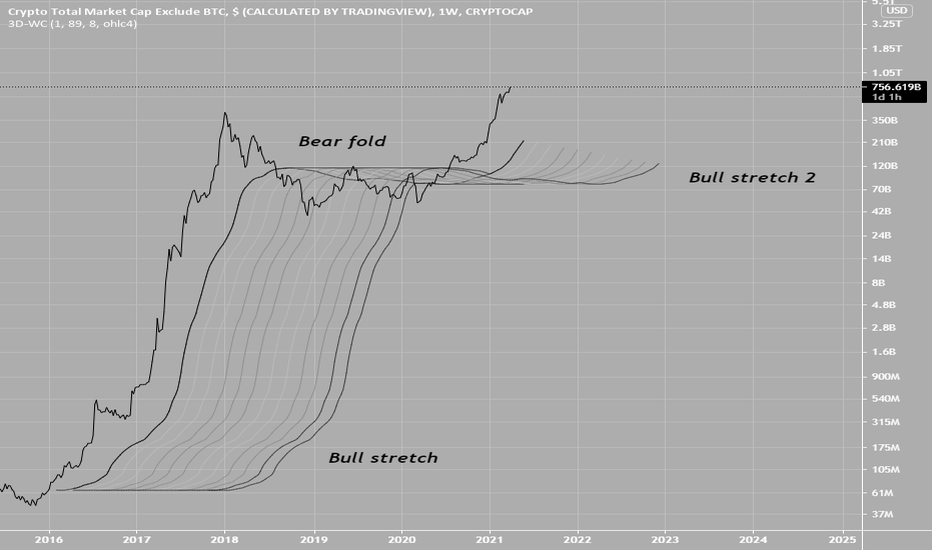
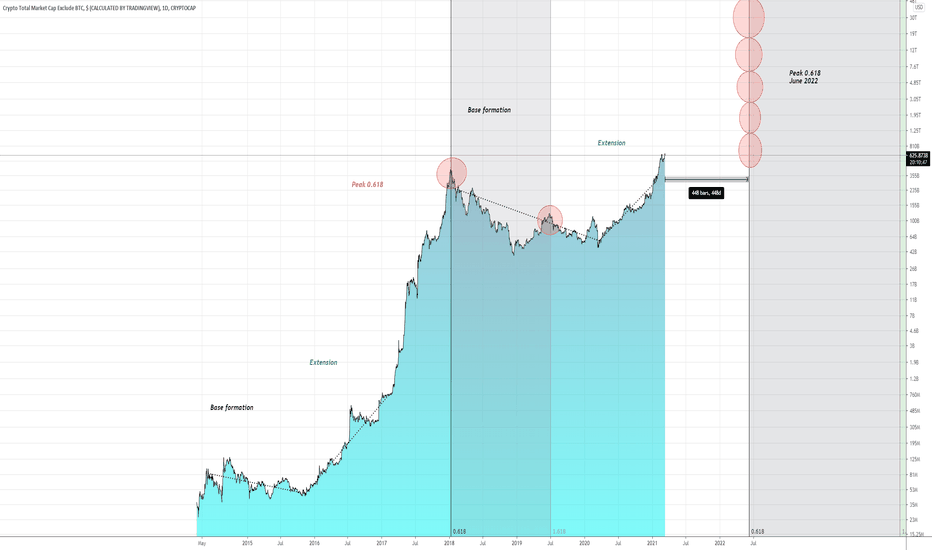
This chart above also suggest June 2022
Similar price points can be seen at .618 and 1.618
The curved pattern is pretty cool to observe, I wonder if it will continue further upwards
We are currently in the green circle, a pullback after a bull run, preparing us for the bigger second phase bull run, which is plotted after the green circle
This chart above also suggest June 2022

Exención de responsabilidad
La información y las publicaciones no constituyen, ni deben considerarse como, asesoramiento o recomendaciones financieras, de inversión, de trading u otro tipo, proporcionadas o respaldadas por TradingView. Obtenga más información en Condiciones de uso.
Exención de responsabilidad
La información y las publicaciones no constituyen, ni deben considerarse como, asesoramiento o recomendaciones financieras, de inversión, de trading u otro tipo, proporcionadas o respaldadas por TradingView. Obtenga más información en Condiciones de uso.