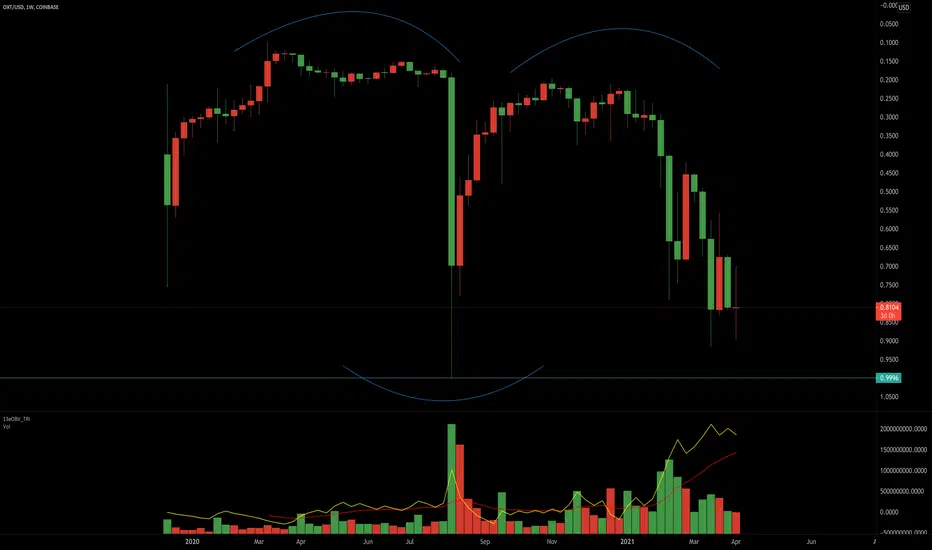
Sometimes I like to invert my charts just for a different perspective. If this was top I would be thinking bear , I certainly would be looking for locations too short (but remember the chart is inverted 🐂). Perhaps the $1.00 wick, exactly $1 wick, come on! This seems like a really important level for me. I think OXT over time will grow even more bullish, but if BTC changes its mind that can really throw all TA out the window, IMO.
*Not trade or financial advice
Beginning trader and technical analyst. Just trying to learn something new everyday. Always appreciate any feedback.
 OXTUSD
[
Operación activa
My HTL is a little off. The high on that day was $1.00 exactly on the chart*Nota
If it can punch through and CLOSE above the resistance on the weekly, I think we can have something bullish to work with, but it has not been able to do this since the week of March 15. Arghhh. Where is Elon when you ned him?Operación cerrada manualmente
No bueno! Oh well. Next bus...
Exención de responsabilidad
La información y las publicaciones no constituyen, ni deben considerarse como, asesoramiento o recomendaciones financieras, de inversión, de trading u otro tipo, proporcionadas o respaldadas por TradingView. Obtenga más información en Condiciones de uso.
Exención de responsabilidad
La información y las publicaciones no constituyen, ni deben considerarse como, asesoramiento o recomendaciones financieras, de inversión, de trading u otro tipo, proporcionadas o respaldadas por TradingView. Obtenga más información en Condiciones de uso.