
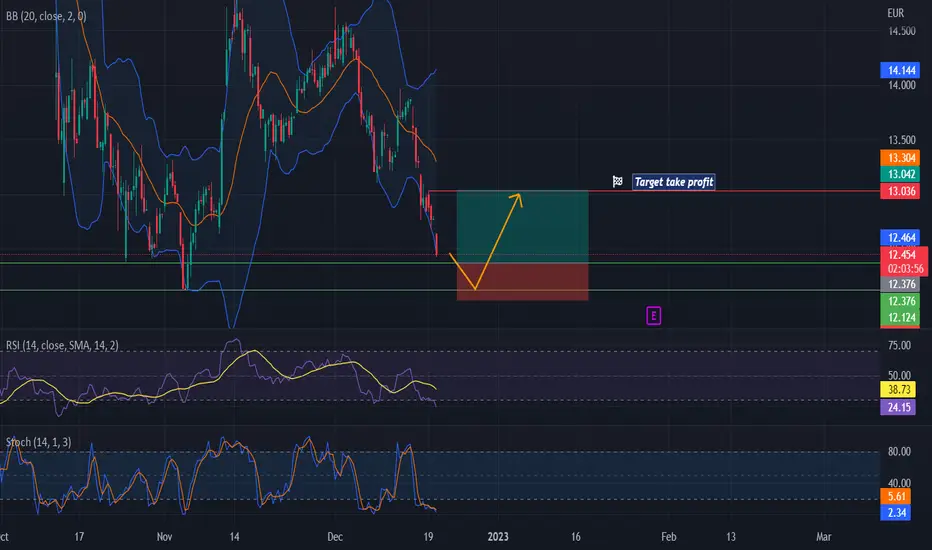
On the Philips chart (PHIA - 4h timeframe), We can see the price is currently oversold. The price is approaching a support area and is probably going to bounce off. Enter and leave the trade at the level defined on the chart.
The three indicators used are Bollinger Bands, RSI, and Stochastics. All these three indicators are confirming the oversold condition.
See all further details on the chart.
Good luck!
The three indicators used are Bollinger Bands, RSI, and Stochastics. All these three indicators are confirming the oversold condition.
See all further details on the chart.
Good luck!
Operación cerrada: objetivo alcanzado
target reached and overshooted.
💥 Free signals and ideas ➡ t.me/vfinvestment
Publicaciones relacionadas
Exención de responsabilidad
La información y las publicaciones no constituyen, ni deben considerarse como, asesoramiento o recomendaciones financieras, de inversión, de trading u otro tipo, proporcionadas o respaldadas por TradingView. Obtenga más información en Condiciones de uso.
💥 Free signals and ideas ➡ t.me/vfinvestment
Publicaciones relacionadas
Exención de responsabilidad
La información y las publicaciones no constituyen, ni deben considerarse como, asesoramiento o recomendaciones financieras, de inversión, de trading u otro tipo, proporcionadas o respaldadas por TradingView. Obtenga más información en Condiciones de uso.