
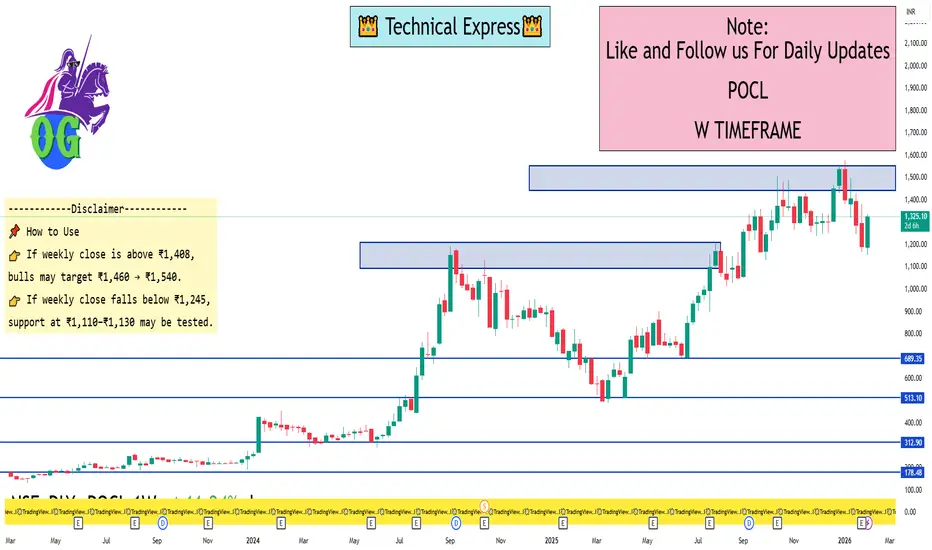
📌 Latest Approx Weekly Pivot Levels (calculated from recent weekly price action):
📈 Weekly Resistance Levels
R1: ~₹1,325–₹1,326
R2: ~₹1,459–₹1,469
R3: ~₹1,540–₹1,572
(Strong resistance zones where weekly price might struggle on the upside)
🔁 Weekly Pivot (Major Reference)
Weekly Pivot (central): ~₹1,407–₹1,408
(This is the main balance point for weekly price — above suggests short-term bullish bias, below indicates bearish bias)
📉 Weekly Support Levels
S1: ~₹1,245–₹1,248
S2: ~₹1,246–₹1,257 (variant levels across methods)
S3: ~₹1,113–₹1,113
S4: ~₹1,187–₹1,188 (from some pivot types)
(These are potential bounce zones if the weekly candle closes lower)
📌 Practical Weekly Level Summary (rounded zones)
Major weekly support zone: ₹1,110–₹1,250
Bullish pivot breakout zone: Above ~₹1,408
Upside target zones: ₹1,460 then ₹1,540+
Critical weekly support to maintain bullish bias: ~₹1,245
📊 Current price (recent trend)
The stock has been trading around ~₹1,300–₹1,330 range recently.
This places it around weekly pivot/slightly below R1, so weekly closes above ₹1,408–₹1,420 would confirm strength, while significant weekly closes below ₹1,245 might signal further weakness.
📈 Weekly Resistance Levels
R1: ~₹1,325–₹1,326
R2: ~₹1,459–₹1,469
R3: ~₹1,540–₹1,572
(Strong resistance zones where weekly price might struggle on the upside)
🔁 Weekly Pivot (Major Reference)
Weekly Pivot (central): ~₹1,407–₹1,408
(This is the main balance point for weekly price — above suggests short-term bullish bias, below indicates bearish bias)
📉 Weekly Support Levels
S1: ~₹1,245–₹1,248
S2: ~₹1,246–₹1,257 (variant levels across methods)
S3: ~₹1,113–₹1,113
S4: ~₹1,187–₹1,188 (from some pivot types)
(These are potential bounce zones if the weekly candle closes lower)
📌 Practical Weekly Level Summary (rounded zones)
Major weekly support zone: ₹1,110–₹1,250
Bullish pivot breakout zone: Above ~₹1,408
Upside target zones: ₹1,460 then ₹1,540+
Critical weekly support to maintain bullish bias: ~₹1,245
📊 Current price (recent trend)
The stock has been trading around ~₹1,300–₹1,330 range recently.
This places it around weekly pivot/slightly below R1, so weekly closes above ₹1,408–₹1,420 would confirm strength, while significant weekly closes below ₹1,245 might signal further weakness.

Publicaciones relacionadas
Exención de responsabilidad
La información y las publicaciones no constituyen, ni deben considerarse como, asesoramiento o recomendaciones financieras, de inversión, de trading u otro tipo, proporcionadas o respaldadas por TradingView. Obtenga más información en Condiciones de uso.
Publicaciones relacionadas
Exención de responsabilidad
La información y las publicaciones no constituyen, ni deben considerarse como, asesoramiento o recomendaciones financieras, de inversión, de trading u otro tipo, proporcionadas o respaldadas por TradingView. Obtenga más información en Condiciones de uso.