
Power Protocol finds resistance —The short side (experts only!)
Good afternoon my fellow Cryptocurrency trader, I hope you are having a nice and profitable day.
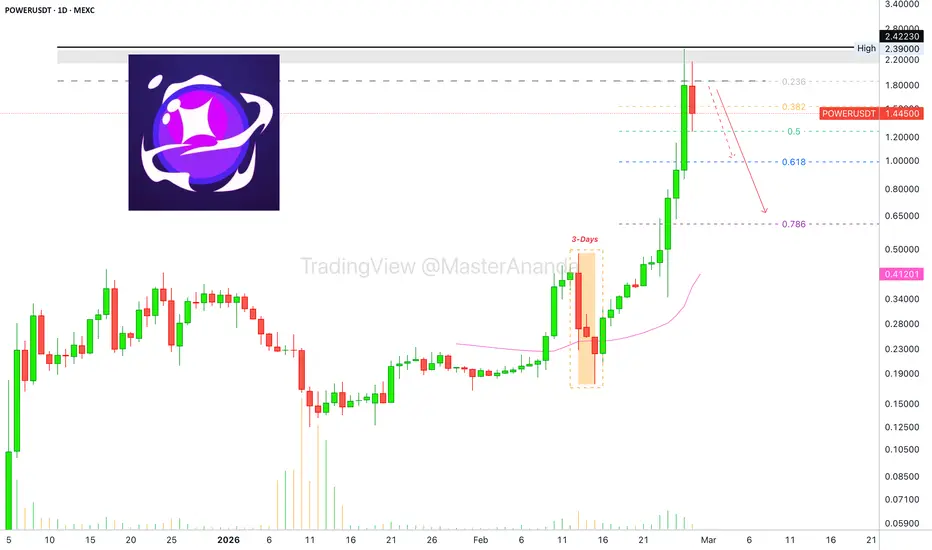
Here we are looking at POWERUSDT (Power Protocol) with the intention to sell.
You know how it goes: Sell at resistance; buy at support.
We have a parabolic rise on this chart and the market always tend to fluctuate, invariably. A rising wave ends with a correction. A correction is followed by a new wave of growth. And we get these cycles endlessly.
POWERUSDT is facing resistance and this can be seen as the action turned red today and it is happening below the 0.236 Fib. retracement level.
Now! The current chart setup doesn't mean that the rise is over. There is no limit to how high a project can go, truly limitless. And remember how it went with the PIPPINUSDT short.
Each time you think the top is in, it can continue higher but, still, a short trade can be entered once resistance is confirmed. This chart has bearish potential. 'Potential' being the key word.
The drop doesn't have a to be a long-term drop either. It can be quick drop followed by additional growth. It can also happen that a drop evolves into a long-term correction. That is why experts only tend to short-trade.
The drop tends to develop much faster compared to the rise. Some people say 2.5 times faster but by now I know these are random numbers because it tends to vary wildly depending on the market, trading instrument and hundreds of other variables.
A drop mid-February lasted only 3 days. A new drop can last 6-12 days. But it can happen that it moves higher first...
Allocation should be small. If you enter and get kicked out, track it to re-enter higher once more. It is already overbought. Can be tricky though.
Thanks a lot for your continued support.
Namaste.
Here we are looking at POWERUSDT (Power Protocol) with the intention to sell.
You know how it goes: Sell at resistance; buy at support.
We have a parabolic rise on this chart and the market always tend to fluctuate, invariably. A rising wave ends with a correction. A correction is followed by a new wave of growth. And we get these cycles endlessly.
POWERUSDT is facing resistance and this can be seen as the action turned red today and it is happening below the 0.236 Fib. retracement level.
Now! The current chart setup doesn't mean that the rise is over. There is no limit to how high a project can go, truly limitless. And remember how it went with the PIPPINUSDT short.
Each time you think the top is in, it can continue higher but, still, a short trade can be entered once resistance is confirmed. This chart has bearish potential. 'Potential' being the key word.
The drop doesn't have a to be a long-term drop either. It can be quick drop followed by additional growth. It can also happen that a drop evolves into a long-term correction. That is why experts only tend to short-trade.
The drop tends to develop much faster compared to the rise. Some people say 2.5 times faster but by now I know these are random numbers because it tends to vary wildly depending on the market, trading instrument and hundreds of other variables.
A drop mid-February lasted only 3 days. A new drop can last 6-12 days. But it can happen that it moves higher first...
Allocation should be small. If you enter and get kicked out, track it to re-enter higher once more. It is already overbought. Can be tricky though.
Thanks a lot for your continued support.
Namaste.
Operación activa
There is potential for a lower high. This is the 4H timeframe: Very risky. Experts onlye!
Operación cerrada: objetivo alcanzado
We are looking at the third lower high... But the chart is still mixed. Volume continues to drop and this supports bearish potential. The RSI is oversold and continues to show exhaustion. The 4H MACD produced a bearish cross already.
Here is the daily chart:
This one is kind of mixed but not very promising. The volume signal shows that a top is most likely in. Approach with caution. The bears become stronger with each passing day when the ath is not challenged.
Namaste.
Nota

Trading Cryptocurrencies can be the hardest undertaking ever without the right trade-numbers, without accurate private-access information. Free is free, but the best always requires sweat, an investment. Since 2017 👇
t.me/masteranandatrades/8778
t.me/masteranandatrades/8778
Publicaciones relacionadas
Exención de responsabilidad
La información y las publicaciones no constituyen, ni deben considerarse como, asesoramiento o recomendaciones financieras, de inversión, de trading u otro tipo, proporcionadas o respaldadas por TradingView. Obtenga más información en Condiciones de uso.
Trading Cryptocurrencies can be the hardest undertaking ever without the right trade-numbers, without accurate private-access information. Free is free, but the best always requires sweat, an investment. Since 2017 👇
t.me/masteranandatrades/8778
t.me/masteranandatrades/8778
Publicaciones relacionadas
Exención de responsabilidad
La información y las publicaciones no constituyen, ni deben considerarse como, asesoramiento o recomendaciones financieras, de inversión, de trading u otro tipo, proporcionadas o respaldadas por TradingView. Obtenga más información en Condiciones de uso.