
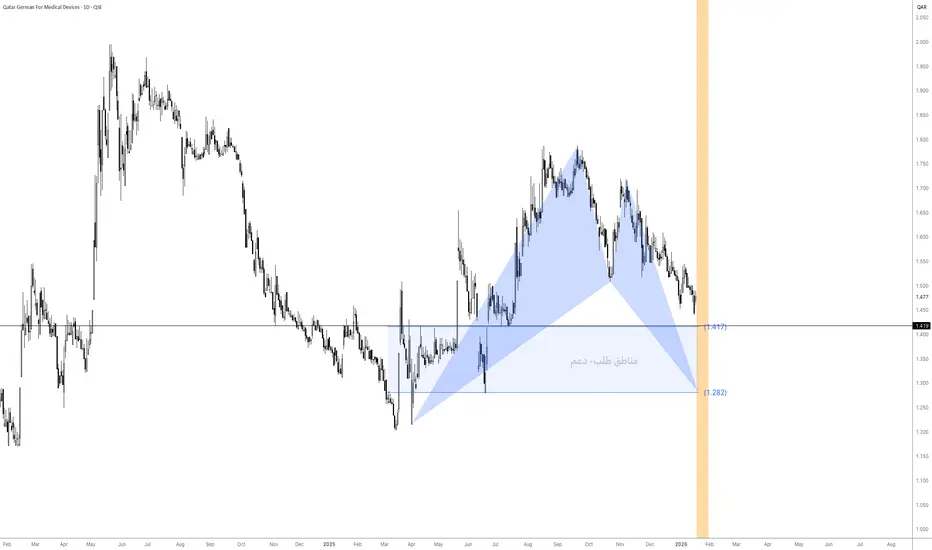
The medium-term trend is bearish, following a clear rejection from the previous highs around 1.75–1.80.
The current price action represents a corrective move within a broader downtrend, not a confirmed trend reversal.
🟦 Demand Zone (Support)
The highlighted blue zone marks a strong historical demand area:
Upper support: 1.417
Lower support: 1.282
This zone previously:
Triggered strong bullish impulses
Acted as a consolidation base
Produced multiple upside reactions
➡️ It is a selective accumulation zone, not a blind-buy area.
🟧 Current Price Context
Price is trading near the upper boundary of the demand zone (~1.42).
The market is testing support:
Holding above → potential rebound
Daily close below → weakness increases
🔻 Scenarios
✅ Bullish Scenario (Conditional)
Daily close holding above 1.417
Appearance of bullish rejection / weakening selling pressure
Potential upside targets:
1.55
1.65
1.72 (major resistance)
📌 This would be a corrective rally, not a confirmed trend reversal unless higher highs are formed.
❌ Bearish Scenario
Daily close below 1.417
Downside targets:
1.35
1.282 (key demand base)
A break below 1.282 would indicate structural breakdown and higher downside risk.

Exención de responsabilidad
La información y las publicaciones no constituyen, ni deben considerarse como, asesoramiento o recomendaciones financieras, de inversión, de trading u otro tipo, proporcionadas o respaldadas por TradingView. Obtenga más información en Condiciones de uso.
Exención de responsabilidad
La información y las publicaciones no constituyen, ni deben considerarse como, asesoramiento o recomendaciones financieras, de inversión, de trading u otro tipo, proporcionadas o respaldadas por TradingView. Obtenga más información en Condiciones de uso.