
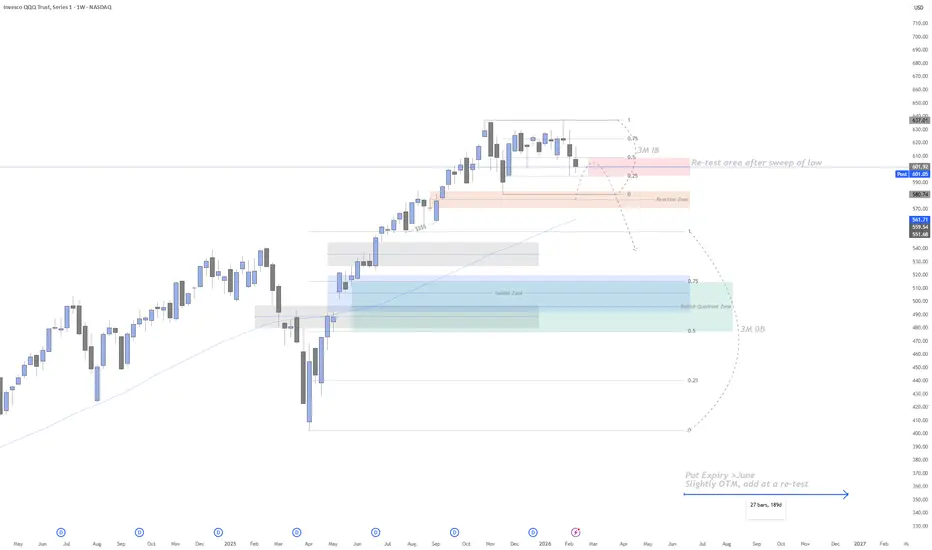
Currently QQQ is in a 3M IB. The target area at the moment is the low at $580. Once this is swept, we should look to trade back into the 3M IB looking at a failure of the .25-.50 Quadrant of the IB; this should bring us further down. Trading past the .50 area of the IB quadrant indicates bullishness.
If bearish, the target then becomes the Golden Zone of the range, which is the 3M OB (starting at April). The Golden Zone has confluence with the OB quadrant (.75-.50 area) which we should see some serious price movement to the upside. A failure of this .75-.50 zone will indicate bearishness, which means we could see further downside movement.
Expiry’s for June + (slightly OTM or ATM) should provide safe returns.
If bearish, the target then becomes the Golden Zone of the range, which is the 3M OB (starting at April). The Golden Zone has confluence with the OB quadrant (.75-.50 area) which we should see some serious price movement to the upside. A failure of this .75-.50 zone will indicate bearishness, which means we could see further downside movement.
Expiry’s for June + (slightly OTM or ATM) should provide safe returns.

Exención de responsabilidad
La información y las publicaciones no constituyen, ni deben considerarse como, asesoramiento o recomendaciones financieras, de inversión, de trading u otro tipo, proporcionadas o respaldadas por TradingView. Obtenga más información en Condiciones de uso.
Exención de responsabilidad
La información y las publicaciones no constituyen, ni deben considerarse como, asesoramiento o recomendaciones financieras, de inversión, de trading u otro tipo, proporcionadas o respaldadas por TradingView. Obtenga más información en Condiciones de uso.