
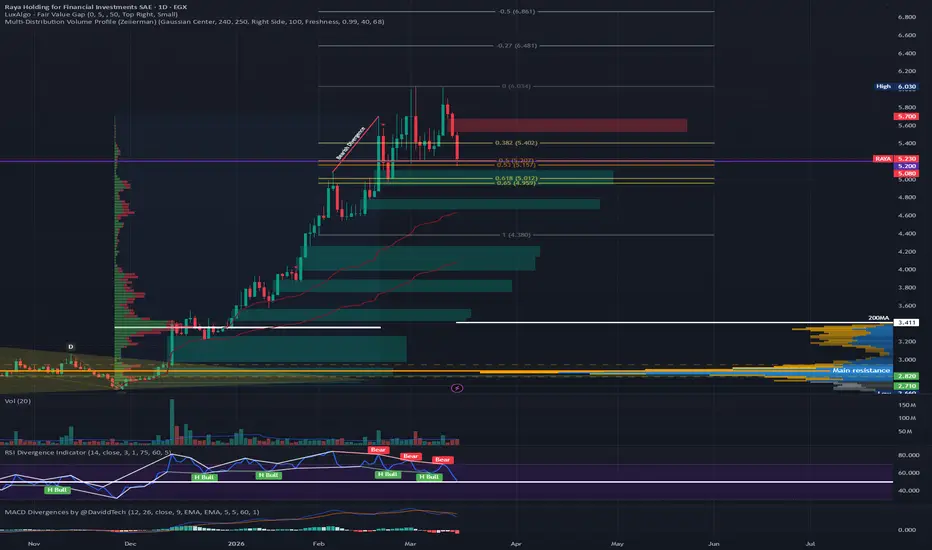
Raya is starting to show signs of a pullback after its recent move 📉.
The stock closed above an important support level at 5.2, which is currently a key level to watch.
⚠️ If 5.2 breaks, it could confirm a double-top pattern, potentially pushing the price toward the following support levels:
• 4.7
• 4.3
The stock is also very stretched and trading far above the 200 MA and main support levels, which increases the risk of a strong correction if new liquidity does not enter the stock. 📊
⚠️ Due to the current market volatility, I don’t recommend entering at this stage.
👉 If you like my analysis, please follow and boost 🚀📊
The stock closed above an important support level at 5.2, which is currently a key level to watch.
⚠️ If 5.2 breaks, it could confirm a double-top pattern, potentially pushing the price toward the following support levels:
• 4.7
• 4.3
The stock is also very stretched and trading far above the 200 MA and main support levels, which increases the risk of a strong correction if new liquidity does not enter the stock. 📊
⚠️ Due to the current market volatility, I don’t recommend entering at this stage.
👉 If you like my analysis, please follow and boost 🚀📊

Publicaciones relacionadas
Exención de responsabilidad
La información y las publicaciones no constituyen, ni deben considerarse como, asesoramiento o recomendaciones financieras, de inversión, de trading u otro tipo, proporcionadas o respaldadas por TradingView. Obtenga más información en Condiciones de uso.
Publicaciones relacionadas
Exención de responsabilidad
La información y las publicaciones no constituyen, ni deben considerarse como, asesoramiento o recomendaciones financieras, de inversión, de trading u otro tipo, proporcionadas o respaldadas por TradingView. Obtenga más información en Condiciones de uso.