
🧠 Chart Structure & Pattern
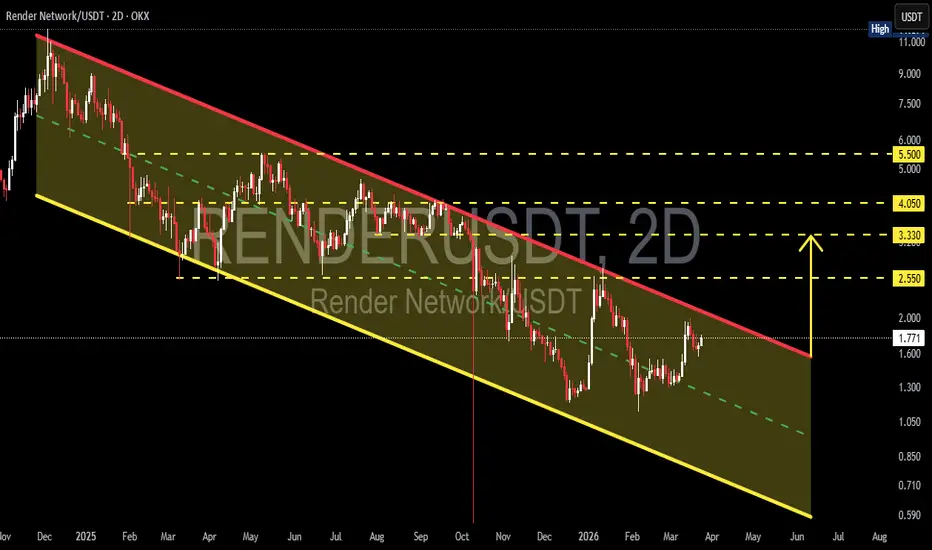
The RENDER/USDT (2D timeframe) chart shows price action moving within a Descending Channel.
Key characteristics:
Resistance line (red) → Lower Highs (consistent selling pressure)
Support line (yellow) → Lower Lows (ongoing downtrend)
Price moves in a zig-zag pattern inside the channel (bearish consolidation)
Midline (green dashed line) → equilibrium / mid-trend area
➡️ This pattern is typically a bearish continuation, but it can also act as an accumulation phase before a reversal if a breakout occurs.
---
📍 Key Levels
Strong Resistance: 3.330 – 4.050 – 5.500
Strong Support: 1.300 – 1.050 – 0.700
Current Price: ~1.77 (near mid-channel)
---
🟢 Bullish Scenario (Reversal / Breakout Up)
Bullish confirmation occurs if:
Price breaks and closes above the red trendline
Supported by increasing volume
Upside targets:
1. 2.550 (minor resistance)
2. 3.330 (first major resistance)
3. 4.050
4. 5.500 (maximum target based on channel structure)
💡 A strong breakout could signal a trend reversal from downtrend to uptrend
---
🔴 Bearish Scenario (Continuation Down)
Bearish bias remains if:
Price fails to break the red trendline
Rejection occurs around 1.8 – 2.0
Downside targets:
1. 1.300 (nearest support)
2. 1.050
3. 0.700 (bottom of the channel)
💡 As long as price remains inside the channel → primary trend is still bearish
---
⚖️ Conclusion
Market is still in a descending channel (bearish structure)
Current price is at a critical zone (mid-channel)
Breakout = high probability reversal
Rejection = continuation of the downtrend
---
🚀 Additional Insight
A long channel often builds strong breakout momentum
The more frequently resistance is tested → the weaker it becomes → increasing breakout probability
#RENDER #RNDR #CryptoAnalysis #TechnicalAnalysis #Altcoin #CryptoTrading #PriceAction #BearishTrend #BullishBreakout #DescendingChannel #SupportResistance #SmartMoney #CryptoSignal
The RENDER/USDT (2D timeframe) chart shows price action moving within a Descending Channel.
Key characteristics:
Resistance line (red) → Lower Highs (consistent selling pressure)
Support line (yellow) → Lower Lows (ongoing downtrend)
Price moves in a zig-zag pattern inside the channel (bearish consolidation)
Midline (green dashed line) → equilibrium / mid-trend area
➡️ This pattern is typically a bearish continuation, but it can also act as an accumulation phase before a reversal if a breakout occurs.
---
📍 Key Levels
Strong Resistance: 3.330 – 4.050 – 5.500
Strong Support: 1.300 – 1.050 – 0.700
Current Price: ~1.77 (near mid-channel)
---
🟢 Bullish Scenario (Reversal / Breakout Up)
Bullish confirmation occurs if:
Price breaks and closes above the red trendline
Supported by increasing volume
Upside targets:
1. 2.550 (minor resistance)
2. 3.330 (first major resistance)
3. 4.050
4. 5.500 (maximum target based on channel structure)
💡 A strong breakout could signal a trend reversal from downtrend to uptrend
---
🔴 Bearish Scenario (Continuation Down)
Bearish bias remains if:
Price fails to break the red trendline
Rejection occurs around 1.8 – 2.0
Downside targets:
1. 1.300 (nearest support)
2. 1.050
3. 0.700 (bottom of the channel)
💡 As long as price remains inside the channel → primary trend is still bearish
---
⚖️ Conclusion
Market is still in a descending channel (bearish structure)
Current price is at a critical zone (mid-channel)
Breakout = high probability reversal
Rejection = continuation of the downtrend
---
🚀 Additional Insight
A long channel often builds strong breakout momentum
The more frequently resistance is tested → the weaker it becomes → increasing breakout probability
#RENDER #RNDR #CryptoAnalysis #TechnicalAnalysis #Altcoin #CryptoTrading #PriceAction #BearishTrend #BullishBreakout #DescendingChannel #SupportResistance #SmartMoney #CryptoSignal

✅ Get Free Signals! Join Our Telegram Channel Here: t.me/TheCryptoNuclear
✅ Twitter: twitter.com/crypto_nuclear
✅ Join Bybit : partner.bybit.com/b/nuclearvip
✅ Benefits : Lifetime Trading Fee Discount -50%
✅ Twitter: twitter.com/crypto_nuclear
✅ Join Bybit : partner.bybit.com/b/nuclearvip
✅ Benefits : Lifetime Trading Fee Discount -50%
Exención de responsabilidad
La información y las publicaciones no constituyen, ni deben considerarse como, asesoramiento o recomendaciones financieras, de inversión, de trading u otro tipo, proporcionadas o respaldadas por TradingView. Obtenga más información en Condiciones de uso.
✅ Get Free Signals! Join Our Telegram Channel Here: t.me/TheCryptoNuclear
✅ Twitter: twitter.com/crypto_nuclear
✅ Join Bybit : partner.bybit.com/b/nuclearvip
✅ Benefits : Lifetime Trading Fee Discount -50%
✅ Twitter: twitter.com/crypto_nuclear
✅ Join Bybit : partner.bybit.com/b/nuclearvip
✅ Benefits : Lifetime Trading Fee Discount -50%
Exención de responsabilidad
La información y las publicaciones no constituyen, ni deben considerarse como, asesoramiento o recomendaciones financieras, de inversión, de trading u otro tipo, proporcionadas o respaldadas por TradingView. Obtenga más información en Condiciones de uso.