
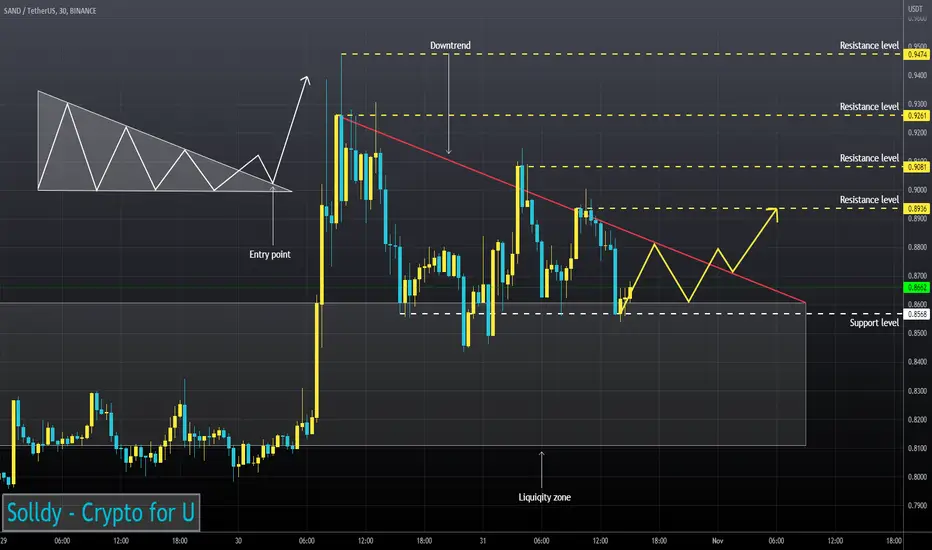
Trading volumes don't show sellers' interest in further price decrease.
SAND continues to move above the liquidity zone.
RSI continues to move in the Buy zone (4H TF) and at 30m Timeframe the RSI chart is testing the support level.
Price is testing 50EMA as support (1H TF)
I think the asset may bounce after it fixes above the downtrend line.
SAND continues to move above the liquidity zone.
RSI continues to move in the Buy zone (4H TF) and at 30m Timeframe the RSI chart is testing the support level.
Price is testing 50EMA as support (1H TF)
I think the asset may bounce after it fixes above the downtrend line.

Publicaciones relacionadas
Exención de responsabilidad
La información y las publicaciones no constituyen, ni deben considerarse como, asesoramiento o recomendaciones financieras, de inversión, de trading u otro tipo, proporcionadas o respaldadas por TradingView. Obtenga más información en Condiciones de uso.
Publicaciones relacionadas
Exención de responsabilidad
La información y las publicaciones no constituyen, ni deben considerarse como, asesoramiento o recomendaciones financieras, de inversión, de trading u otro tipo, proporcionadas o respaldadas por TradingView. Obtenga más información en Condiciones de uso.