
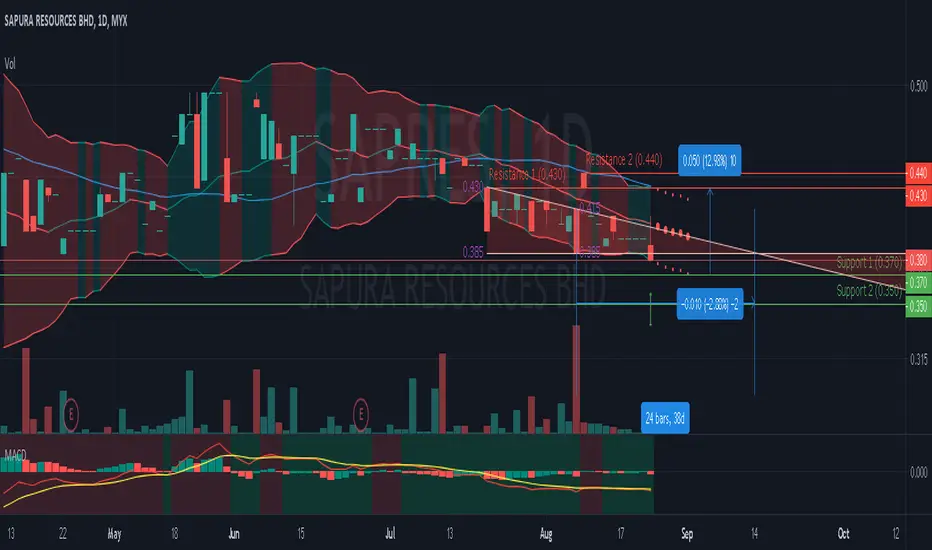
Technically, it is not looking good for SAPRES as its 20-Day Moving Average is sloping downward and its price action is below the Moving Average line.
This is further compounded by the recent bearish breakout of the support level of 0.385.
This breakout was accompanied by a higher than average traded volume which shows the bearishness of the traders to push the price lower and past this support hence pointing to higher probability of a bearish breakout.
Resistance 1 : 0.430 (12.98%)
Resistance 2 : 0.440
Support 1 : 0.370
Support 2 : 0.350
Descending Triangle prediction at 7 Aug 2020.
Possible bearish price movement towards the support 0.370 within the next 38 days (24 bars : ETA 14 Sep 2020).
This is further compounded by the recent bearish breakout of the support level of 0.385.
This breakout was accompanied by a higher than average traded volume which shows the bearishness of the traders to push the price lower and past this support hence pointing to higher probability of a bearish breakout.
Resistance 1 : 0.430 (12.98%)
Resistance 2 : 0.440
Support 1 : 0.370
Support 2 : 0.350
Descending Triangle prediction at 7 Aug 2020.
Possible bearish price movement towards the support 0.370 within the next 38 days (24 bars : ETA 14 Sep 2020).

Exención de responsabilidad
La información y las publicaciones no constituyen, ni deben considerarse como, asesoramiento o recomendaciones financieras, de inversión, de trading u otro tipo, proporcionadas o respaldadas por TradingView. Obtenga más información en Condiciones de uso.
Exención de responsabilidad
La información y las publicaciones no constituyen, ni deben considerarse como, asesoramiento o recomendaciones financieras, de inversión, de trading u otro tipo, proporcionadas o respaldadas por TradingView. Obtenga más información en Condiciones de uso.