
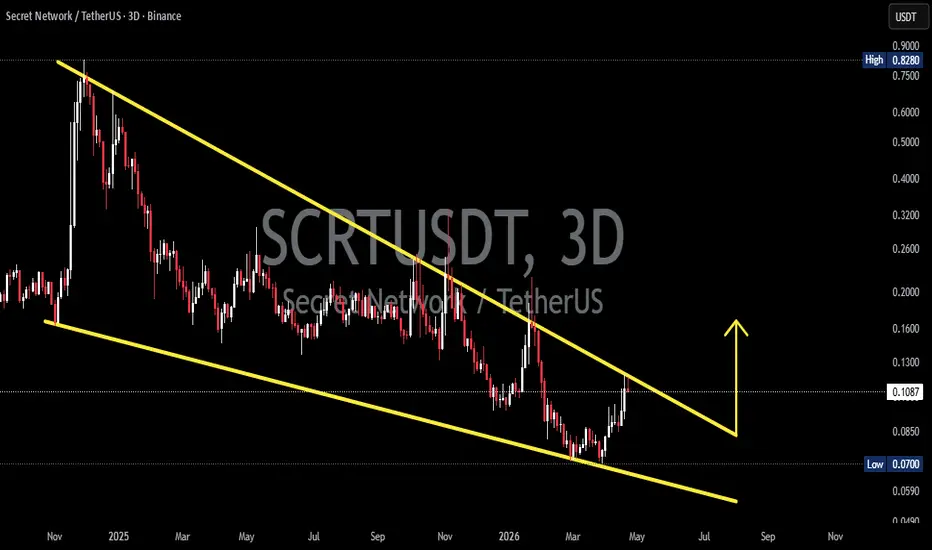
On the 3D timeframe, SCRT/USDT appears to be moving within a Falling Wedge pattern, which has been forming for quite some time since the previous peak. This structure is characterized by:
Consistent Lower Highs (LH) at the resistance area
Continuous Lower Lows (LL) with a narrowing price range
Price currently making a pullback upward toward wedge resistance
This wedge suggests that, on a macro level, bearish pressure is starting to weaken, and price is now at a crucial area to determine the next direction.
---
📐 Pattern Structure: Falling Wedge
A Falling Wedge is typically a bullish reversal pattern, even though it forms during a downtrend.
Key characteristics in this chart:
Both resistance and support trendlines are sloping downward and converging
Volatility is decreasing → indicating potential for breakout
Price is approaching the upper boundary → a critical reaction zone
---
🔼 Bullish Scenario
Bullish confirmation becomes stronger if a decisive breakout occurs from the wedge:
Confirmation:
Break & close above wedge resistance (around 0.11 – 0.13 area)
Supported by increasing volume
Potential Targets:
Initial target: 0.16
Next targets: 0.20 – 0.26
Extended move toward previous supply zone around 0.30+
Narrative: A breakout from a falling wedge often signals the start of a trend reversal. If this plays out, SCRT could transition from a prolonged distribution phase into accumulation → markup phase.
---
🔽 Bearish Scenario
If price fails to break the resistance:
Confirmation:
Strong rejection at wedge resistance
Appearance of bearish continuation candles
Downside Targets:
Return to support: 0.07
If breakdown occurs: potential continuation toward 0.05 or lower
Narrative: Although a falling wedge is typically bullish, failure to break out may keep price under pressure and extend the downtrend before any meaningful reversal occurs.
---
⚖️ Key Levels
Wedge Resistance: 0.11 – 0.13
Mid Support: around 0.09
Major Support: 0.07
Breakout Zone: above the wedge (bullish confirmation)
---
🧠 Conclusion
SCRT is currently at a critical decision zone.
Breakout = strong reversal potential
Rejection = possible continuation of the downtrend
Traders should wait for confirmation, not prediction, especially around the current resistance area.
#SCRT #SCRTUSDT #CryptoAnalysis #TechnicalAnalysis #Altcoin #FallingWedge #Breakout #CryptoTrading #BullishReversal #SupportResistance #SmartMoney #PriceAction
Consistent Lower Highs (LH) at the resistance area
Continuous Lower Lows (LL) with a narrowing price range
Price currently making a pullback upward toward wedge resistance
This wedge suggests that, on a macro level, bearish pressure is starting to weaken, and price is now at a crucial area to determine the next direction.
---
📐 Pattern Structure: Falling Wedge
A Falling Wedge is typically a bullish reversal pattern, even though it forms during a downtrend.
Key characteristics in this chart:
Both resistance and support trendlines are sloping downward and converging
Volatility is decreasing → indicating potential for breakout
Price is approaching the upper boundary → a critical reaction zone
---
🔼 Bullish Scenario
Bullish confirmation becomes stronger if a decisive breakout occurs from the wedge:
Confirmation:
Break & close above wedge resistance (around 0.11 – 0.13 area)
Supported by increasing volume
Potential Targets:
Initial target: 0.16
Next targets: 0.20 – 0.26
Extended move toward previous supply zone around 0.30+
Narrative: A breakout from a falling wedge often signals the start of a trend reversal. If this plays out, SCRT could transition from a prolonged distribution phase into accumulation → markup phase.
---
🔽 Bearish Scenario
If price fails to break the resistance:
Confirmation:
Strong rejection at wedge resistance
Appearance of bearish continuation candles
Downside Targets:
Return to support: 0.07
If breakdown occurs: potential continuation toward 0.05 or lower
Narrative: Although a falling wedge is typically bullish, failure to break out may keep price under pressure and extend the downtrend before any meaningful reversal occurs.
---
⚖️ Key Levels
Wedge Resistance: 0.11 – 0.13
Mid Support: around 0.09
Major Support: 0.07
Breakout Zone: above the wedge (bullish confirmation)
---
🧠 Conclusion
SCRT is currently at a critical decision zone.
Breakout = strong reversal potential
Rejection = possible continuation of the downtrend
Traders should wait for confirmation, not prediction, especially around the current resistance area.
#SCRT #SCRTUSDT #CryptoAnalysis #TechnicalAnalysis #Altcoin #FallingWedge #Breakout #CryptoTrading #BullishReversal #SupportResistance #SmartMoney #PriceAction

✅ Get Free Signals! Join Our Telegram Channel Here: t.me/TheCryptoNuclear
✅ Twitter: twitter.com/crypto_nuclear
✅ Join Bybit : partner.bybit.com/b/nuclearvip
✅ Benefits : Lifetime Trading Fee Discount -50%
✅ Twitter: twitter.com/crypto_nuclear
✅ Join Bybit : partner.bybit.com/b/nuclearvip
✅ Benefits : Lifetime Trading Fee Discount -50%
Exención de responsabilidad
La información y las publicaciones no constituyen, ni deben considerarse como, asesoramiento o recomendaciones financieras, de inversión, de trading u otro tipo, proporcionadas o respaldadas por TradingView. Obtenga más información en Condiciones de uso.
✅ Get Free Signals! Join Our Telegram Channel Here: t.me/TheCryptoNuclear
✅ Twitter: twitter.com/crypto_nuclear
✅ Join Bybit : partner.bybit.com/b/nuclearvip
✅ Benefits : Lifetime Trading Fee Discount -50%
✅ Twitter: twitter.com/crypto_nuclear
✅ Join Bybit : partner.bybit.com/b/nuclearvip
✅ Benefits : Lifetime Trading Fee Discount -50%
Exención de responsabilidad
La información y las publicaciones no constituyen, ni deben considerarse como, asesoramiento o recomendaciones financieras, de inversión, de trading u otro tipo, proporcionadas o respaldadas por TradingView. Obtenga más información en Condiciones de uso.