
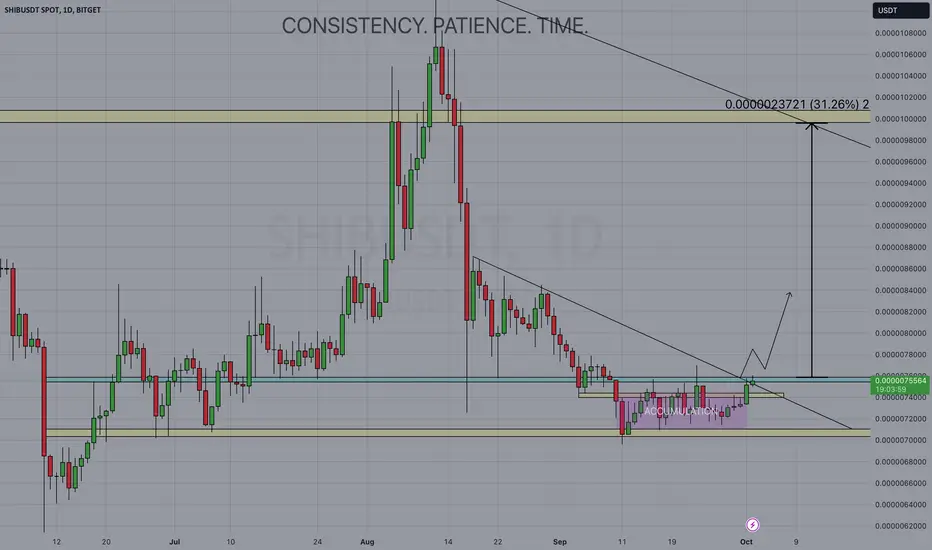
📈 Analysis: After nearly a month of consolidation, SHIB seems ready to rejoin the cryptocurrency market action.
Accumulation and Support: During this period, SHIB held strong support levels within the range of 0.00000710 to 0.00000705, clearly marked in the highlighted box.
🚀 Bullish Signals: On the daily chart, SHIB shows signs of breaking out of this accumulation zone, backed by a 12-hour bullish price action. Our primary focus remains on the daily chart.
Key Indicators: To validate a bullish scenario, we require a shift in market sentiment, a flip of the blue zone on the daily chart, strong bullish volume, and possibly some bullish news.
💹 The Potential Upside: If these conditions align, we may witness a significant pump, targeting the next zone of interest at 0.00000100, offering a potential 30% upside. This level correlates with a longer-term trend line, easily visible on the 3D chart.
Confirmation: For confirmation of this educational idea, watch for a break above this level followed by a retest.
Disclaimer: This analysis serves as guidance and not definitive instructions. Conduct thorough research and consult with a financial advisor before making any investment decisions.
Accumulation and Support: During this period, SHIB held strong support levels within the range of 0.00000710 to 0.00000705, clearly marked in the highlighted box.
🚀 Bullish Signals: On the daily chart, SHIB shows signs of breaking out of this accumulation zone, backed by a 12-hour bullish price action. Our primary focus remains on the daily chart.
Key Indicators: To validate a bullish scenario, we require a shift in market sentiment, a flip of the blue zone on the daily chart, strong bullish volume, and possibly some bullish news.
💹 The Potential Upside: If these conditions align, we may witness a significant pump, targeting the next zone of interest at 0.00000100, offering a potential 30% upside. This level correlates with a longer-term trend line, easily visible on the 3D chart.
Confirmation: For confirmation of this educational idea, watch for a break above this level followed by a retest.
Disclaimer: This analysis serves as guidance and not definitive instructions. Conduct thorough research and consult with a financial advisor before making any investment decisions.
Nota
First rejection of the area this morning, with the entire ALTS bleeding out a bit, idea still valid till we are above the 0.00000710 Support levels.Will follow up in the next few days.

Luca Sepe
Exención de responsabilidad
La información y las publicaciones no constituyen, ni deben considerarse como, asesoramiento o recomendaciones financieras, de inversión, de trading u otro tipo, proporcionadas o respaldadas por TradingView. Obtenga más información en Condiciones de uso.
Luca Sepe
Exención de responsabilidad
La información y las publicaciones no constituyen, ni deben considerarse como, asesoramiento o recomendaciones financieras, de inversión, de trading u otro tipo, proporcionadas o respaldadas por TradingView. Obtenga más información en Condiciones de uso.