Corto
SHOP- rectangle pattern - short
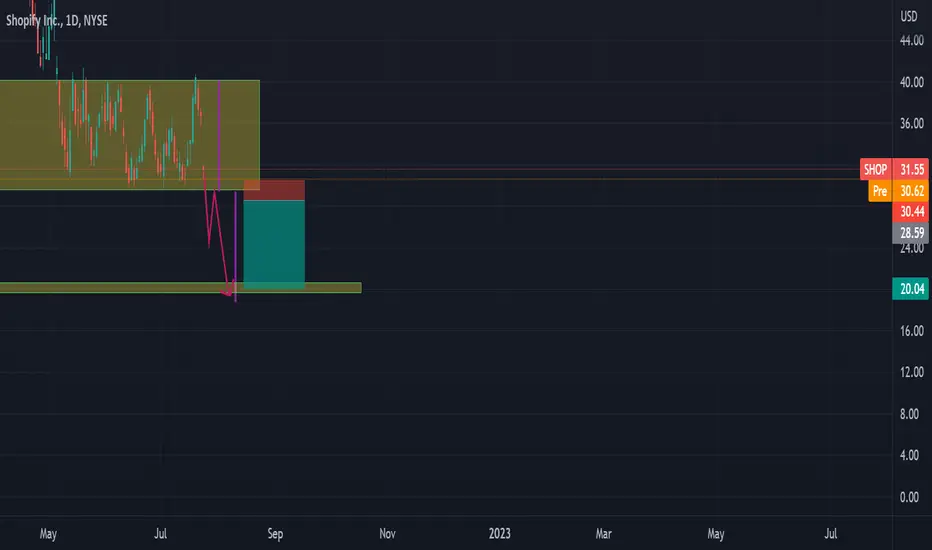
Shopify stock is in the range . It looks like the price is creating a rectangle pattern which may break to the downside.
Enter the trade if the price breaks below the rectangle and it retests the bottom of the rectangle as a resistance .
Target and the stop loss are shown in the chart.
Enter the trade if the price breaks below the rectangle and it retests the bottom of the rectangle as a resistance .
Target and the stop loss are shown in the chart.

💥 Free signals and ideas ➡ t.me/vfinvestment
Exención de responsabilidad
La información y las publicaciones no constituyen, ni deben considerarse como, asesoramiento o recomendaciones financieras, de inversión, de trading u otro tipo, proporcionadas o respaldadas por TradingView. Obtenga más información en Condiciones de uso.
💥 Free signals and ideas ➡ t.me/vfinvestment
Exención de responsabilidad
La información y las publicaciones no constituyen, ni deben considerarse como, asesoramiento o recomendaciones financieras, de inversión, de trading u otro tipo, proporcionadas o respaldadas por TradingView. Obtenga más información en Condiciones de uso.