
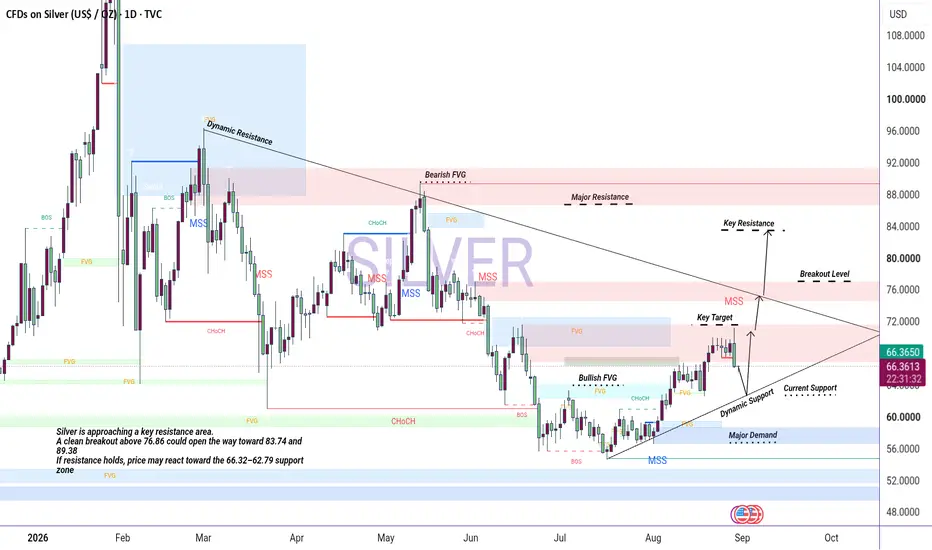
This Silver (XAGUSD) 1D analysis focuses on the current market structure, key liquidity levels, Fair Value Gaps (FVG), Market Structure Shifts (MSS), Change of Character (CHoCH), and major support and resistance zones.
The price action shows a clear structural movement from the lower demand areas toward the current trading region. The earlier bullish structure produced multiple BOS signals, while subsequent bearish pressure created several MSS and CHoCH formations. These shifts are important because they show how momentum has changed across different phases of the market.
The upper resistance area around 76.86 is a key level to monitor. A strong daily close above this region could confirm further bullish continuation and potentially expose the higher resistance levels around 83.74 and 89.38. These areas should be treated as important reaction and liquidity zones rather than guaranteed targets.
On the downside, the 66.32 and 62.79 areas represent important support regions. If price fails to maintain the current structure and breaks below these levels, the next major demand area around 56.55 becomes important for monitoring a possible reaction.
The descending trendline is acting as dynamic resistance, while the rising trendline provides dynamic support and creates a compression structure between buyers and sellers. The FVG zones on the chart are also being monitored as potential areas where price may return to rebalance inefficient price movement.
Each candle is read in relation to the surrounding structure, liquidity, momentum, and reaction zones. The objective of this analysis is to understand price behavior and market structure rather than predict every individual candle.
Always wait for confirmation through price action and structure before considering any trade setup. This chart is provided for educational and analytical purposes only, not as financial advice.
Operación activa
Operación cerrada manualmente
Keep strong Hold wait for my last target 
What You'll Get
Daily Forex signals with high accuracy
t.me/+2Bz-lcNYpz04MGM0
fundamental analysis
Risk management tips to
protect your capital
Join now and start winn
t.me/+_drPZUCEV-EyNjlk
Daily Forex signals with high accuracy
t.me/+2Bz-lcNYpz04MGM0
fundamental analysis
Risk management tips to
protect your capital
Join now and start winn
t.me/+_drPZUCEV-EyNjlk
Publicaciones relacionadas
Exención de responsabilidad
La información y las publicaciones no constituyen, ni deben considerarse como, asesoramiento o recomendaciones financieras, de inversión, de trading u otro tipo, proporcionadas o respaldadas por TradingView. Obtenga más información en Condiciones de uso.