
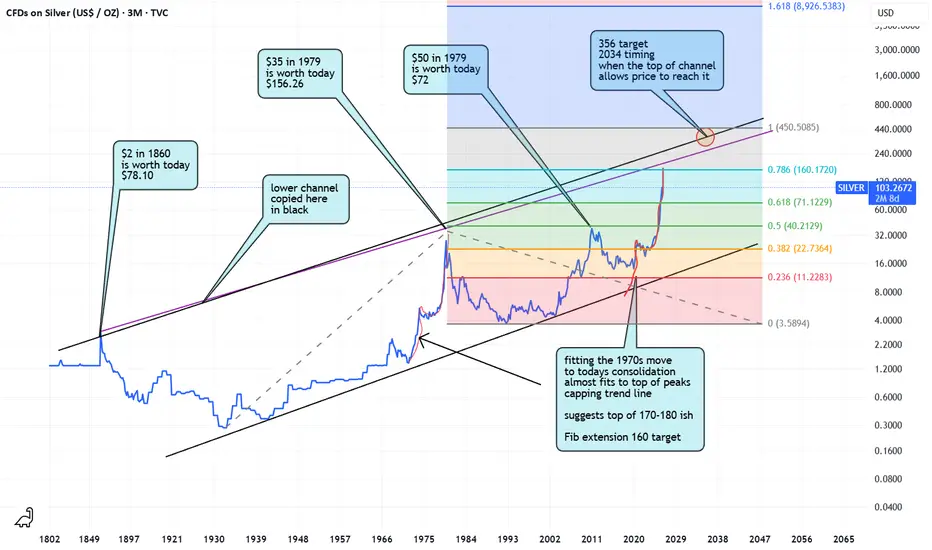
Looking at the prior peaks adjusted by asking google to give me an adjusted price gave this. I was thinking that $100 silver seems a lot but its really not if you think about inflation and that in 1880 silver was say around the $2 level and how much was $2 worth all those years ago?
If you used this analysis a couple of years ago when silver was in the 20's 30's then you could instantly see that silver was undervalued vs inflation etc
Drawing a trend line on top of the peaks suggests potential inflection points at top of channel.
Using the lower trend line copied and put on the top of the 1970 peak black
Using wedge 45 year pattern I have target of say $356
So when will the trend lines cross at this point say 2034 year
So if you trace the move of silver in 1970's and best fit it to todays consolidation triangle breakout in red line, you get a top target of between 170-180
Using the fib extension tool you can say the fib levels align to 160 for the next big fib level target. However the fib 1 level is much much higher guessing 450 ish many years later.
Because the wedge pattern is 45 years long then this pattern could reach target in say 15 years time that would be normal, and the price 450 ish not accurate just directional. So if the target is made and it took 30% of the pattern time to achieve it. Thats quite realistic for a wedge pattern.
Also if you time the prior move say 1930 to 1980 rounding up, say 50 years, we already had 46 years of pattern so if the cycles are similar then we have 4 years left to make the rest of this move which if its a bigger blow off top we could see a spike higher right about now over the next few years up to say 160-170-180 area very quickly. Or where ever the trend line sits as time moves it further out. So further bullish potential exists, I think we get a few months wobble here then then it moves again but I could be wrong too
But $150 move is in line with inflation, and the real inflation is much higher than the US accounting process, go look at shadow stats on the web etc. With those numbers they may be much more realistic too
If you used this analysis a couple of years ago when silver was in the 20's 30's then you could instantly see that silver was undervalued vs inflation etc
Drawing a trend line on top of the peaks suggests potential inflection points at top of channel.
Using the lower trend line copied and put on the top of the 1970 peak black
Using wedge 45 year pattern I have target of say $356
So when will the trend lines cross at this point say 2034 year
So if you trace the move of silver in 1970's and best fit it to todays consolidation triangle breakout in red line, you get a top target of between 170-180
Using the fib extension tool you can say the fib levels align to 160 for the next big fib level target. However the fib 1 level is much much higher guessing 450 ish many years later.
Because the wedge pattern is 45 years long then this pattern could reach target in say 15 years time that would be normal, and the price 450 ish not accurate just directional. So if the target is made and it took 30% of the pattern time to achieve it. Thats quite realistic for a wedge pattern.
Also if you time the prior move say 1930 to 1980 rounding up, say 50 years, we already had 46 years of pattern so if the cycles are similar then we have 4 years left to make the rest of this move which if its a bigger blow off top we could see a spike higher right about now over the next few years up to say 160-170-180 area very quickly. Or where ever the trend line sits as time moves it further out. So further bullish potential exists, I think we get a few months wobble here then then it moves again but I could be wrong too
But $150 move is in line with inflation, and the real inflation is much higher than the US accounting process, go look at shadow stats on the web etc. With those numbers they may be much more realistic too

Exención de responsabilidad
La información y las publicaciones no constituyen, ni deben considerarse como, asesoramiento o recomendaciones financieras, de inversión, de trading u otro tipo, proporcionadas o respaldadas por TradingView. Obtenga más información en Condiciones de uso.
Exención de responsabilidad
La información y las publicaciones no constituyen, ni deben considerarse como, asesoramiento o recomendaciones financieras, de inversión, de trading u otro tipo, proporcionadas o respaldadas por TradingView. Obtenga más información en Condiciones de uso.