
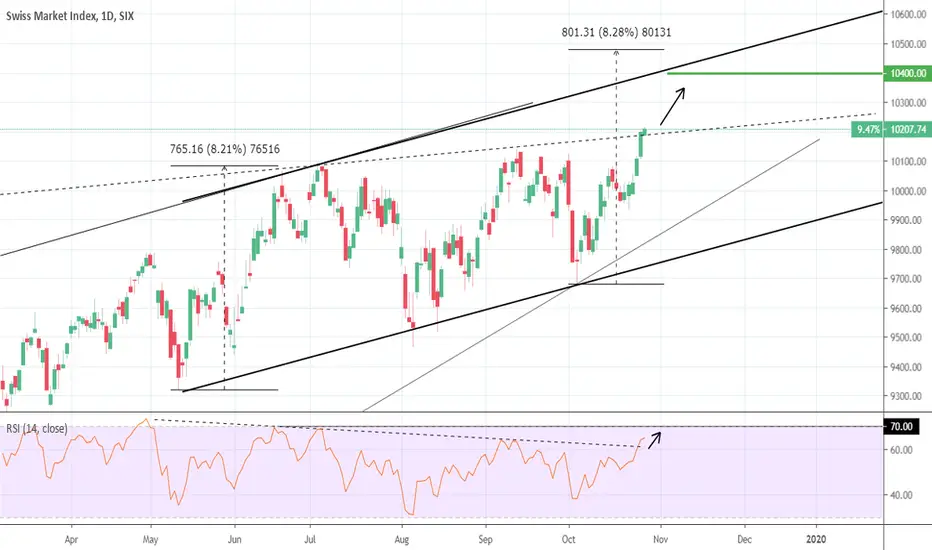
The Swiss market has broken above the Rising Wedge's resisting trend line (dashed) and may follow the 1W Channel Up pattern (RSI = 63.217, MACD = 177.900, Highs/Lows = 173.0836) which started in early May. Based on the RSI break out it has an upside potential to at least 10,400.
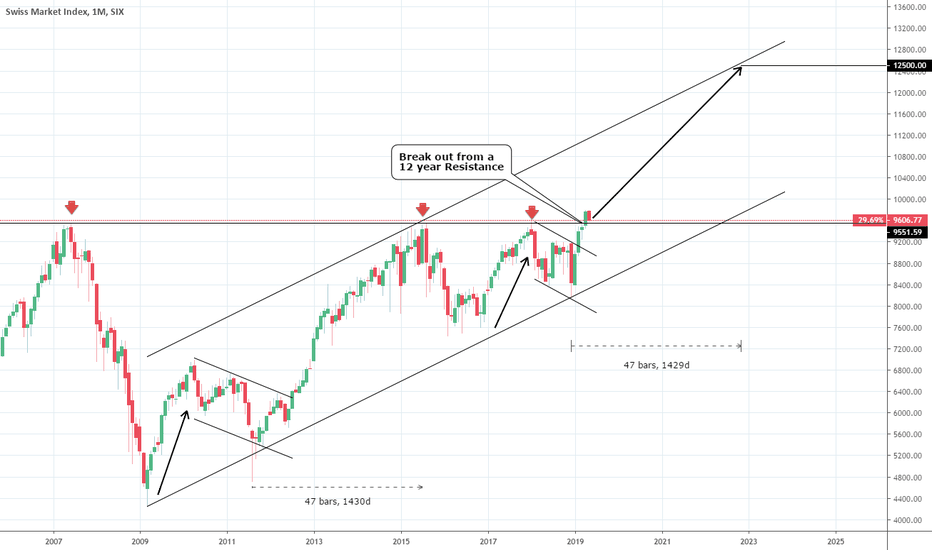
Keep in mind that this break out is part of a larger bullish move as we illustrated in May (see the chart below). The Swiss Market Index (SMI) has entered a new long term Bull Cycle after it broke above its 12 year Resistance last April:
** If you like our free content follow our profile (tradingview.com/u/InvestingScope) to get more daily ideas. **
Comments and likes are greatly appreciated.
Keep in mind that this break out is part of a larger bullish move as we illustrated in May (see the chart below). The Swiss Market Index (SMI) has entered a new long term Bull Cycle after it broke above its 12 year Resistance last April:
** If you like our free content follow our profile (tradingview.com/u/InvestingScope) to get more daily ideas. **
Comments and likes are greatly appreciated.

I trade Crypto, Forex, Indices & Commodities all from one account on PrimeXBT with TradingView charts
Register here👉 investingscope.s.gy/PrimeXBT
Contact me for Account Management (+15% monthly profit)
Telegram👉 t.me/investingscope
Register here👉 investingscope.s.gy/PrimeXBT
Contact me for Account Management (+15% monthly profit)
Telegram👉 t.me/investingscope
Exención de responsabilidad
La información y las publicaciones no constituyen, ni deben considerarse como, asesoramiento o recomendaciones financieras, de inversión, de trading u otro tipo, proporcionadas o respaldadas por TradingView. Obtenga más información en Condiciones de uso.
I trade Crypto, Forex, Indices & Commodities all from one account on PrimeXBT with TradingView charts
Register here👉 investingscope.s.gy/PrimeXBT
Contact me for Account Management (+15% monthly profit)
Telegram👉 t.me/investingscope
Register here👉 investingscope.s.gy/PrimeXBT
Contact me for Account Management (+15% monthly profit)
Telegram👉 t.me/investingscope
Exención de responsabilidad
La información y las publicaciones no constituyen, ni deben considerarse como, asesoramiento o recomendaciones financieras, de inversión, de trading u otro tipo, proporcionadas o respaldadas por TradingView. Obtenga más información en Condiciones de uso.