Overview of Recent Price Action
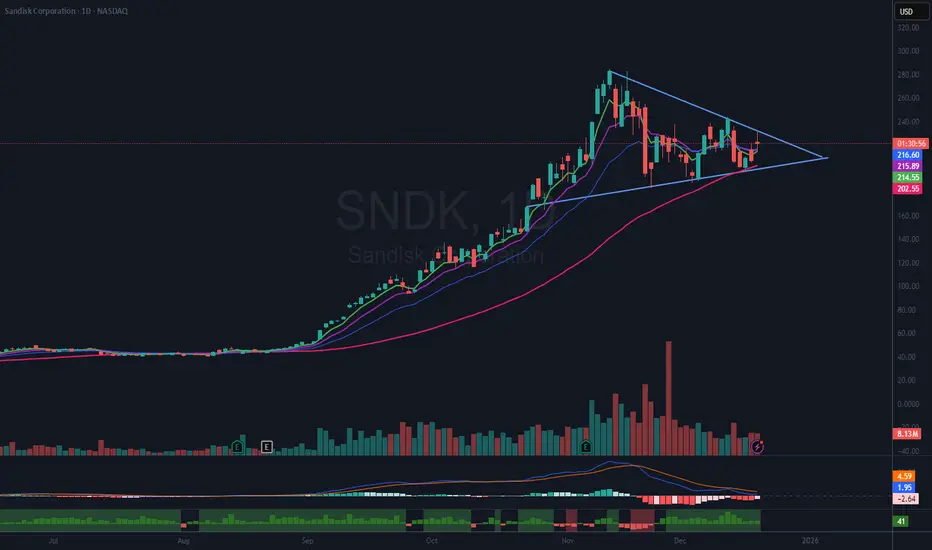
Since breaking out in September, Sandisk ( SNDK) has experienced a significant upward move, gaining over 400%. The stock reached its recent high on November 12th and has since been consolidating those gains. Following the peak, SNDK retraced to test the 50-day moving average (DMA), shown in red, and has been oscillating around the 21-day exponential moving average (EMA), indicated in blue.
Technical Pattern: Volatility Contraction
The current price action has formed a wedging pattern that closely resembles the Volatility Contraction Pattern (VCP), a setup popularized by Mark Minervini. This is one of Minervini’s preferred patterns for trading, as it often precedes significant price movements when the pattern resolves.
Current Position and Trade Management
Today, a half-sized position was initiated in anticipation of a breakout above the downward-sloping trendline that defines the wedge. The 21 EMA will serve as a reference point for managing risk; a decisive close below this moving average will act as a trigger for the stop loss. If the stock breaks out of the wedge as anticipated, there will be an opportunity to add to the position.
Risk Management and Disclaimer
Readers are strongly encouraged to conduct their own analysis and adhere to their individual trading strategies. It is important to recognize that all investments carry inherent risk. Careful and informed decision-making is essential when allocating capital in financial markets.
Since breaking out in September, Sandisk (
SNDK) has experienced a significant upward move, gaining over 400%. The stock reached its recent high on November 12th and has since been consolidating those gains. Following the peak, SNDK retraced to test the 50-day moving average (DMA), shown in red, and has been oscillating around the 21-day exponential moving average (EMA), indicated in blue.Technical Pattern: Volatility Contraction
The current price action has formed a wedging pattern that closely resembles the Volatility Contraction Pattern (VCP), a setup popularized by Mark Minervini. This is one of Minervini’s preferred patterns for trading, as it often precedes significant price movements when the pattern resolves.
Current Position and Trade Management
Today, a half-sized position was initiated in anticipation of a breakout above the downward-sloping trendline that defines the wedge. The 21 EMA will serve as a reference point for managing risk; a decisive close below this moving average will act as a trigger for the stop loss. If the stock breaks out of the wedge as anticipated, there will be an opportunity to add to the position.
Risk Management and Disclaimer
Readers are strongly encouraged to conduct their own analysis and adhere to their individual trading strategies. It is important to recognize that all investments carry inherent risk. Careful and informed decision-making is essential when allocating capital in financial markets.
Nota
SNDK Look at that breakout. I will be looking to add to this position soon. I want to make sure the breakout holds.Operación activa
SNDK I added to this position today to bring it up to a full size. Today's purchase was @ $251.My average price is now 236.76.Nota
SNDK All I can say is WOW! Look at this monster move since it broke out of the VCP. 45%!!! I have taken 1/2 of my position off here just to book some profits. I will look to add back if it pulls back and consolidates. If not, I will continue to ride it with my 1/2 size remaining.Operación cerrada manualmente
I have scaled out of this trade over the last 3 days with the biggest chunk sold today. I have averaged 26.2% on this trade. The reason I closed it out is today's outside bearish bar. It will still be on my watchlist and I will wait to see if it sets up again.
Ideas I publish are my own. They are not meant to be investment / trading advice. You are encouraged to do your own due diligence.
I am under no obligation to post any action or update to any idea.
Follow me on "X" where I post more content.
I am under no obligation to post any action or update to any idea.
Follow me on "X" where I post more content.
Exención de responsabilidad
La información y las publicaciones no constituyen, ni deben considerarse como, asesoramiento o recomendaciones financieras, de inversión, de trading u otro tipo, proporcionadas o respaldadas por TradingView. Obtenga más información en Condiciones de uso.
Ideas I publish are my own. They are not meant to be investment / trading advice. You are encouraged to do your own due diligence.
I am under no obligation to post any action or update to any idea.
Follow me on "X" where I post more content.
I am under no obligation to post any action or update to any idea.
Follow me on "X" where I post more content.
Exención de responsabilidad
La información y las publicaciones no constituyen, ni deben considerarse como, asesoramiento o recomendaciones financieras, de inversión, de trading u otro tipo, proporcionadas o respaldadas por TradingView. Obtenga más información en Condiciones de uso.