
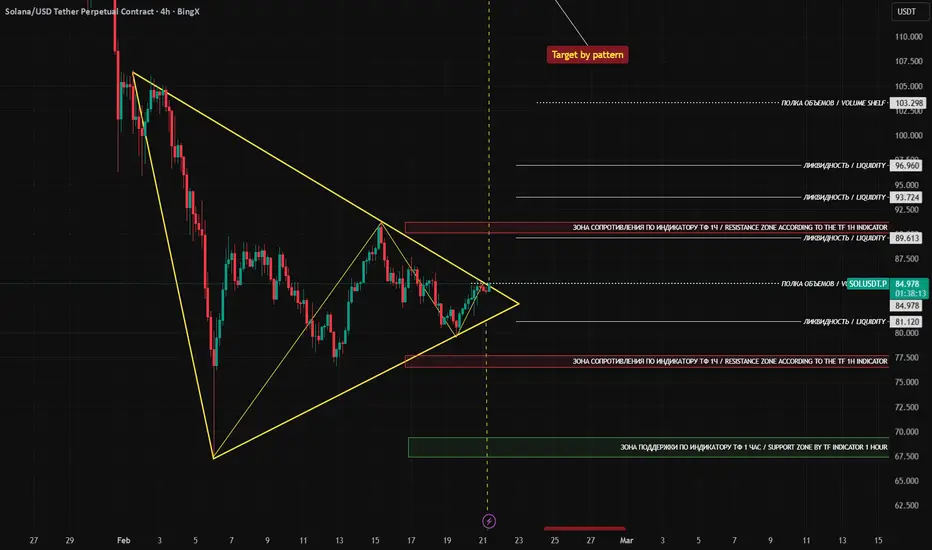
A Triangle pattern has formed on the SOL chart. The longer the squeeze, the harder the move.
🔍 Details:
— Support and resistance zones are marked on the chart.
— Liquidity (price magnet) is indicated — that's where stops usually get taken.
📚 Trading Logic:
I explained how to read Triangle patterns in previous posts.
Entry only on confirmation! No confirmation = no trade.
💡 My Strategy:
When price approaches my entry zone, I follow a strict algorithm. No pending orders — only alerts and manual execution.
➡️ Here's my checklist:
▪️ I check the 5-min RSI. If it's oversold or overbought — it's a signal to pay attention. If not — I wait.
▪️ I draw a trendline on the RSI itself, based on recent highs or lows.
▪️ I wait for a break of that RSI trendline. Once it breaks, I activate the rest of my tools.
➡️ Then I confirm with multiple indicators:
▪️ At least two oscillators have flipped color (green/red).
▪️ Whales have exited their shorts/longs.
▪️ Buyer/Seller impulse has appeared.
▪️ If I previously got a Pump/Dump signal — that's a huge bullish/bearish factor for me.
➡️ Why does this matter?
RSI gives me the first alert, but I only act on confluence. RSI alone = false entry.
RSI + oscillators + whales + impulse = 95% probability of a winning trade.
This multi-layered approach lets me:
— Enter at the peak of momentum
— Catch the best price
— Trade with the most favorable leverage
Those who've been with me know the win rate. Add this to your toolkit! 🎯
Profit to everyone! 🚀
🔍 Details:
— Support and resistance zones are marked on the chart.
— Liquidity (price magnet) is indicated — that's where stops usually get taken.
📚 Trading Logic:
I explained how to read Triangle patterns in previous posts.
Entry only on confirmation! No confirmation = no trade.
💡 My Strategy:
When price approaches my entry zone, I follow a strict algorithm. No pending orders — only alerts and manual execution.
➡️ Here's my checklist:
▪️ I check the 5-min RSI. If it's oversold or overbought — it's a signal to pay attention. If not — I wait.
▪️ I draw a trendline on the RSI itself, based on recent highs or lows.
▪️ I wait for a break of that RSI trendline. Once it breaks, I activate the rest of my tools.
➡️ Then I confirm with multiple indicators:
▪️ At least two oscillators have flipped color (green/red).
▪️ Whales have exited their shorts/longs.
▪️ Buyer/Seller impulse has appeared.
▪️ If I previously got a Pump/Dump signal — that's a huge bullish/bearish factor for me.
➡️ Why does this matter?
RSI gives me the first alert, but I only act on confluence. RSI alone = false entry.
RSI + oscillators + whales + impulse = 95% probability of a winning trade.
This multi-layered approach lets me:
— Enter at the peak of momentum
— Catch the best price
— Trade with the most favorable leverage
Those who've been with me know the win rate. Add this to your toolkit! 🎯
Profit to everyone! 🚀

SUPER INDICATOR:
👉🏻Test Drive for Free
EN: t.me/Multiindicator_bot?start=tr10635
👉🏻ИНДИКАТОР (RUS)
t.me/Midas_indicator_bot?start=1742114840
✅Buy&Sell
✅AI Analysis
✅WinRate 75%
✅RR
📢 RUS: t.me/Indicator_Tony
👉🏻Test Drive for Free
EN: t.me/Multiindicator_bot?start=tr10635
👉🏻ИНДИКАТОР (RUS)
t.me/Midas_indicator_bot?start=1742114840
✅Buy&Sell
✅AI Analysis
✅WinRate 75%
✅RR
📢 RUS: t.me/Indicator_Tony
Publicaciones relacionadas
Exención de responsabilidad
La información y las publicaciones no constituyen, ni deben considerarse como, asesoramiento o recomendaciones financieras, de inversión, de trading u otro tipo, proporcionadas o respaldadas por TradingView. Obtenga más información en Condiciones de uso.
SUPER INDICATOR:
👉🏻Test Drive for Free
EN: t.me/Multiindicator_bot?start=tr10635
👉🏻ИНДИКАТОР (RUS)
t.me/Midas_indicator_bot?start=1742114840
✅Buy&Sell
✅AI Analysis
✅WinRate 75%
✅RR
📢 RUS: t.me/Indicator_Tony
👉🏻Test Drive for Free
EN: t.me/Multiindicator_bot?start=tr10635
👉🏻ИНДИКАТОР (RUS)
t.me/Midas_indicator_bot?start=1742114840
✅Buy&Sell
✅AI Analysis
✅WinRate 75%
✅RR
📢 RUS: t.me/Indicator_Tony
Publicaciones relacionadas
Exención de responsabilidad
La información y las publicaciones no constituyen, ni deben considerarse como, asesoramiento o recomendaciones financieras, de inversión, de trading u otro tipo, proporcionadas o respaldadas por TradingView. Obtenga más información en Condiciones de uso.