
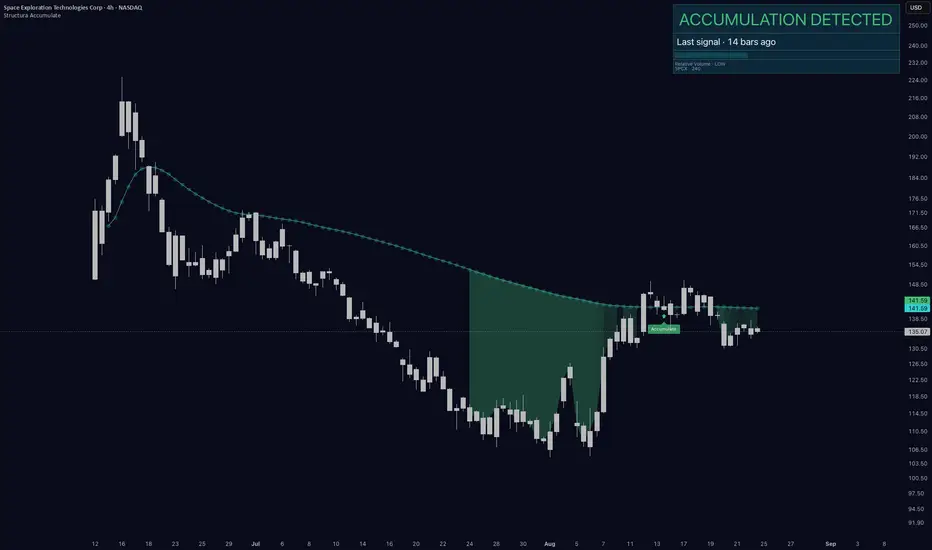
A young chart is the hardest place to be honest about a tool. SPCX has a few months of trading history - which means every layer reading it has had a few months to learn it, not years. We publish the read anyway, and we say that limitation out loud, because a tool that only speaks where it looks good is not a tool.
What the structure layer marked. After the post-IPO run to the low 220s, price spent June and July giving most of it back, and built a base through the summer around 107-118. Across that base the panel marked an accumulation zone, and the signal you can see on the chart was stamped 14 bars ago [•] on this 4h clock - printed into the base, dated before the question of "was that the low" had an answer. The adaptive reference sits at 141.59. Relative volume on the current tape reads LOW.
The first attempt is already on the chart. In mid-August price pushed up through the reference and spent a handful of bars above it - then gave the level back and returned below. We are not going to dress that up: an attempt that does not hold is information, the same way an attempt that holds would have been. The level was touched, the market was not ready to stay there, and the chart says so in public.
What we are watching now is the second approach. Price sits just under the line, a few percent below it, drifting back toward the level rather than away from it. Whether a second attempt comes, and whether it behaves differently from the first, is not something we predict - it is something the chart will answer. Two things would make that answer worth reading: what participation does (relative volume is LOW - a push on quiet tape is a weaker fact than the same push on expanding tape), and what happens on any retest from above, if price gets there at all.
The protocol is the same as always. Acceptance means price back above the reference and staying accepted there - retests holding, participation firming. Rejection means a second failure at the line, or a slide back toward the zone lows - and that would be information too, not an embarrassment. Zones can fail. Young charts fail faster than old ones, because there is less structure underneath them to lean on.
One more thing worth naming: this panel has spoken exactly once in this chart's entire life - 14 bars ago [•]. On an instrument this young, that silence is most of the story. The layer is not built to narrate every candle; it is built to mark the few places worth watching. This is one. What happens at it is the market's job.
Educational market commentary - not financial advice.
What the structure layer marked. After the post-IPO run to the low 220s, price spent June and July giving most of it back, and built a base through the summer around 107-118. Across that base the panel marked an accumulation zone, and the signal you can see on the chart was stamped 14 bars ago [•] on this 4h clock - printed into the base, dated before the question of "was that the low" had an answer. The adaptive reference sits at 141.59. Relative volume on the current tape reads LOW.
The first attempt is already on the chart. In mid-August price pushed up through the reference and spent a handful of bars above it - then gave the level back and returned below. We are not going to dress that up: an attempt that does not hold is information, the same way an attempt that holds would have been. The level was touched, the market was not ready to stay there, and the chart says so in public.
What we are watching now is the second approach. Price sits just under the line, a few percent below it, drifting back toward the level rather than away from it. Whether a second attempt comes, and whether it behaves differently from the first, is not something we predict - it is something the chart will answer. Two things would make that answer worth reading: what participation does (relative volume is LOW - a push on quiet tape is a weaker fact than the same push on expanding tape), and what happens on any retest from above, if price gets there at all.
The protocol is the same as always. Acceptance means price back above the reference and staying accepted there - retests holding, participation firming. Rejection means a second failure at the line, or a slide back toward the zone lows - and that would be information too, not an embarrassment. Zones can fail. Young charts fail faster than old ones, because there is less structure underneath them to lean on.
One more thing worth naming: this panel has spoken exactly once in this chart's entire life - 14 bars ago [•]. On an instrument this young, that silence is most of the story. The layer is not built to narrate every candle; it is built to mark the few places worth watching. This is one. What happens at it is the market's job.
Educational market commentary - not financial advice.

Market structure intelligence. We map process, not predictions - structure, momentum, and trend in one disciplined read. No standalone buy/sell signals. structuramarkets.com
Exención de responsabilidad
La información y las publicaciones no constituyen, ni deben considerarse como, asesoramiento o recomendaciones financieras, de inversión, de trading u otro tipo, proporcionadas o respaldadas por TradingView. Obtenga más información en Condiciones de uso.
Market structure intelligence. We map process, not predictions - structure, momentum, and trend in one disciplined read. No standalone buy/sell signals. structuramarkets.com
Exención de responsabilidad
La información y las publicaciones no constituyen, ni deben considerarse como, asesoramiento o recomendaciones financieras, de inversión, de trading u otro tipo, proporcionadas o respaldadas por TradingView. Obtenga más información en Condiciones de uso.