
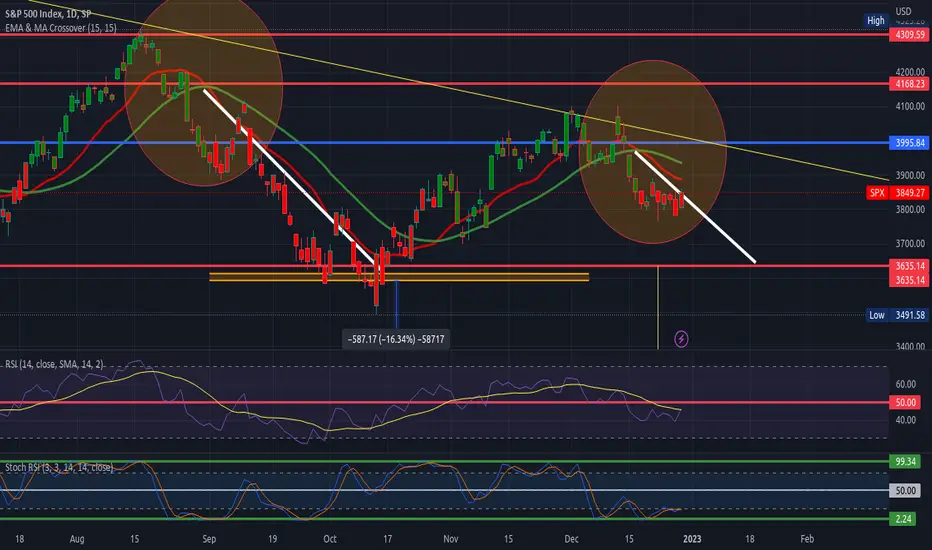
We have seen a movement similar to the two previous crosses, each of them reached the support around 3600, parallel to this pattern a downward compression triangle is forming, which can confirm a loss of support, the stochastic rsi marks oversold but the rsi is positioned downwards and the rsi is held by the bears, that is, a bearish pattern.

Exención de responsabilidad
La información y las publicaciones no constituyen, ni deben considerarse como, asesoramiento o recomendaciones financieras, de inversión, de trading u otro tipo, proporcionadas o respaldadas por TradingView. Obtenga más información en Condiciones de uso.
Exención de responsabilidad
La información y las publicaciones no constituyen, ni deben considerarse como, asesoramiento o recomendaciones financieras, de inversión, de trading u otro tipo, proporcionadas o respaldadas por TradingView. Obtenga más información en Condiciones de uso.