
Technical Analysis and Outlook:
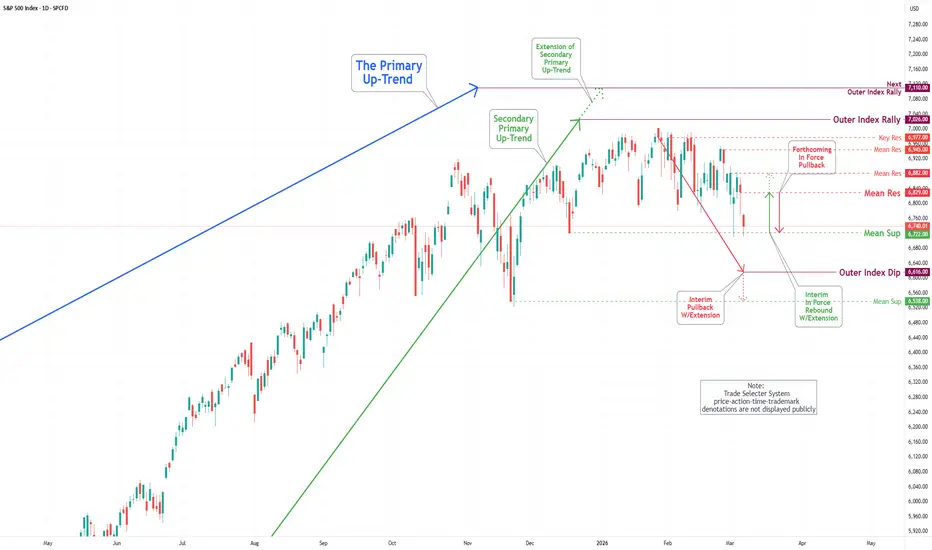
The S&P 500 Index experienced a substantial decline this week, decreasing from the inverse Mean Support level of 6,877 to the Mean Support level of 6,722.
In the forthcoming trading session, the S&P 500 Index is expected to demonstrate a recovery by retesting the Mean Resistance level of 6,829 and possibly extending to the subsequent Mean Resistance level of 6,882.
Nonetheless, one of these levels indicates a significant likelihood of a gradual and steady-to-lower decline toward the Mean Support at 6,722, which may ultimately lead to the completion of the Outer Index Dip at 6,616.
The S&P 500 Index experienced a substantial decline this week, decreasing from the inverse Mean Support level of 6,877 to the Mean Support level of 6,722.
In the forthcoming trading session, the S&P 500 Index is expected to demonstrate a recovery by retesting the Mean Resistance level of 6,829 and possibly extending to the subsequent Mean Resistance level of 6,882.
Nonetheless, one of these levels indicates a significant likelihood of a gradual and steady-to-lower decline toward the Mean Support at 6,722, which may ultimately lead to the completion of the Outer Index Dip at 6,616.

Publicaciones relacionadas
Exención de responsabilidad
La información y las publicaciones no constituyen, ni deben considerarse como, asesoramiento o recomendaciones financieras, de inversión, de trading u otro tipo, proporcionadas o respaldadas por TradingView. Obtenga más información en Condiciones de uso.
Publicaciones relacionadas
Exención de responsabilidad
La información y las publicaciones no constituyen, ni deben considerarse como, asesoramiento o recomendaciones financieras, de inversión, de trading u otro tipo, proporcionadas o respaldadas por TradingView. Obtenga más información en Condiciones de uso.