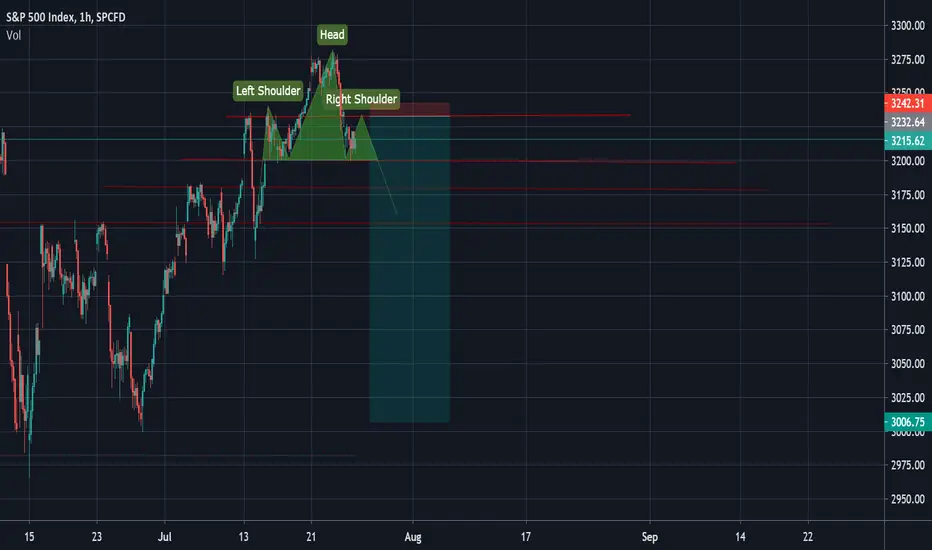
 SPXUSDA double top has formed on the smaller timeframe charts. Broader Outlook - A "head and shoulder" (currently forming the right shoulder) - to prepare for quite an interesting drop. The red lines represent possible support levels as the price journeys down. Comment your thoughts below

Publicaciones relacionadas
Exención de responsabilidad
La información y las publicaciones no constituyen, ni deben considerarse como, asesoramiento o recomendaciones financieras, de inversión, de trading u otro tipo, proporcionadas o respaldadas por TradingView. Obtenga más información en Condiciones de uso.