
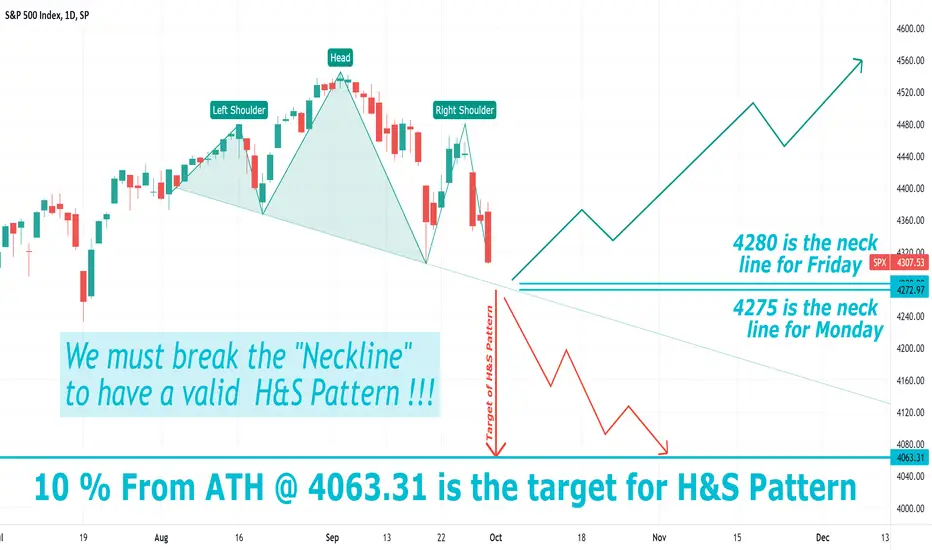
what Is a Head and Shoulders Pattern?
A head and shoulders pattern is a chart formation that appears as a baseline with three peaks, where the outside two are close in height and the middle is highest. In technical analysis, a head and shoulders pattern describes a specific chart formation that predicts a bullish-to-bearish trend reversal.
The head and shoulders pattern is believed to be one of the most reliable trend reversal patterns. It is one of several top patterns that signal, with varying degrees of accuracy, that an upward trend is nearing its end.
KEY TAKEAWAYS
A head and shoulders pattern is a technical indicator with a chart pattern of three peaks, where the outer two are close in height and the middle is the highest.
A head and shoulders pattern—considered one of the most reliable trend reversal patterns—is a chart formation that predicts a bullish-to-bearish trend reversal.
Nota
Today's breaking points is 4275 & we are far a way from it does not look like we are going to break it today !!!Nota
We might lose symmetry here between the R & L shoulders, not a big of a deal " No science here" just ART :-)Nota
Loosing symmetry here this could/might be invalidated soon, or not we shall see.
I do more in depth studies of stocks on my twitter account. Hope you would enjoy it there as you are enjoying it here.
****** Past performance is no guarantee of future results***
twitter.com/samitrading1
****** Past performance is no guarantee of future results***
twitter.com/samitrading1
Exención de responsabilidad
La información y las publicaciones no constituyen, ni deben considerarse como, asesoramiento o recomendaciones financieras, de inversión, de trading u otro tipo, proporcionadas o respaldadas por TradingView. Obtenga más información en Condiciones de uso.