
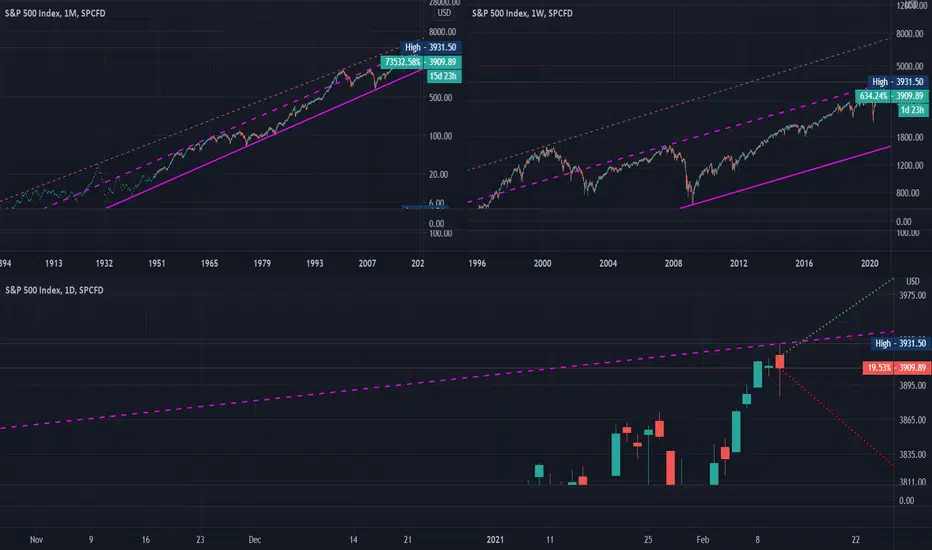
As you can see on these charts-the price is once again beating the channel resistance (purple dotted line). Perhaps the price will have to adjust to the level of $1950, equal to the Fibonacci correction of 0.618%. There is another more positive and desirable scenario for everyone - if there is very good news, the price will be able to gain a foothold above the purple line and go even higher-up to the pink dotted line.
Nota
*logarithmic graph
Exención de responsabilidad
La información y las publicaciones no constituyen, ni deben considerarse como, asesoramiento o recomendaciones financieras, de inversión, de trading u otro tipo, proporcionadas o respaldadas por TradingView. Obtenga más información en Condiciones de uso.
Exención de responsabilidad
La información y las publicaciones no constituyen, ni deben considerarse como, asesoramiento o recomendaciones financieras, de inversión, de trading u otro tipo, proporcionadas o respaldadas por TradingView. Obtenga más información en Condiciones de uso.