
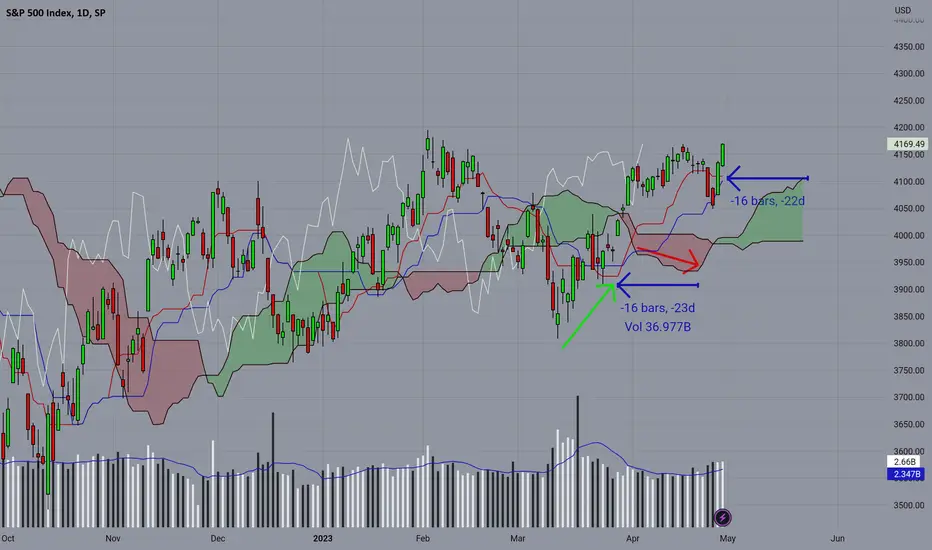
Here we have a 16 bar lag. The price breaches bearish and then beltlines bullish, and the red cloud continues bearish around the bullish low. Note: a signal for a lower low but price is a higher low is a reverse bullish signal. This example is a reverse bullish divergence signal methodology.

Exención de responsabilidad
La información y las publicaciones no constituyen, ni deben considerarse como, asesoramiento o recomendaciones financieras, de inversión, de trading u otro tipo, proporcionadas o respaldadas por TradingView. Obtenga más información en Condiciones de uso.
Exención de responsabilidad
La información y las publicaciones no constituyen, ni deben considerarse como, asesoramiento o recomendaciones financieras, de inversión, de trading u otro tipo, proporcionadas o respaldadas por TradingView. Obtenga más información en Condiciones de uso.