
Bull market to continue to 2029-30
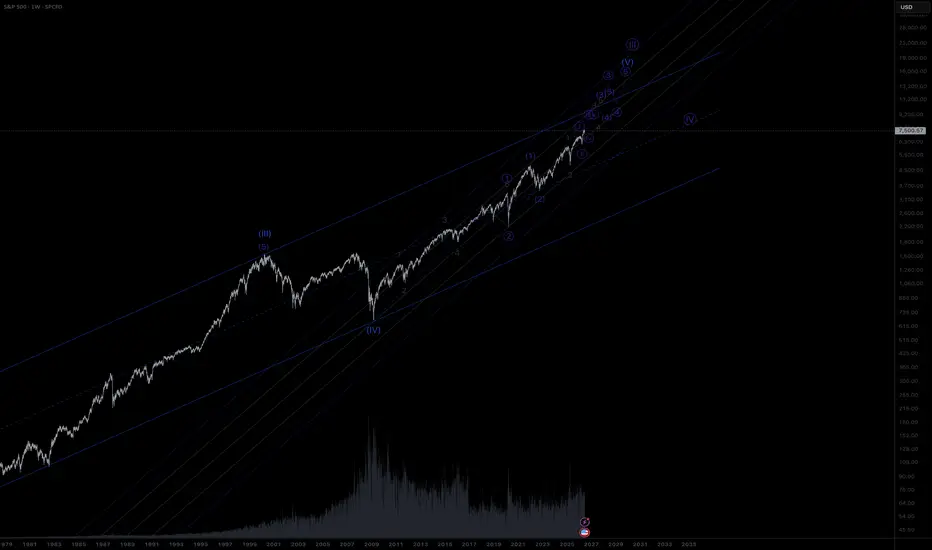
As per the last published idea here is the SPX weekly chart with a suggested Elliot Wave count to take us up till 2029-30. After this the correction will either be a Wave IV or a large Wave 1-2 which could be more of a depression in the 2030's.
As per the last published idea here is the SPX weekly chart with a suggested Elliot Wave count to take us up till 2029-30. After this the correction will either be a Wave IV or a large Wave 1-2 which could be more of a depression in the 2030's.

Exención de responsabilidad
La información y las publicaciones no constituyen, ni deben considerarse como, asesoramiento o recomendaciones financieras, de inversión, de trading u otro tipo, proporcionadas o respaldadas por TradingView. Obtenga más información en Condiciones de uso.
Exención de responsabilidad
La información y las publicaciones no constituyen, ni deben considerarse como, asesoramiento o recomendaciones financieras, de inversión, de trading u otro tipo, proporcionadas o respaldadas por TradingView. Obtenga más información en Condiciones de uso.