
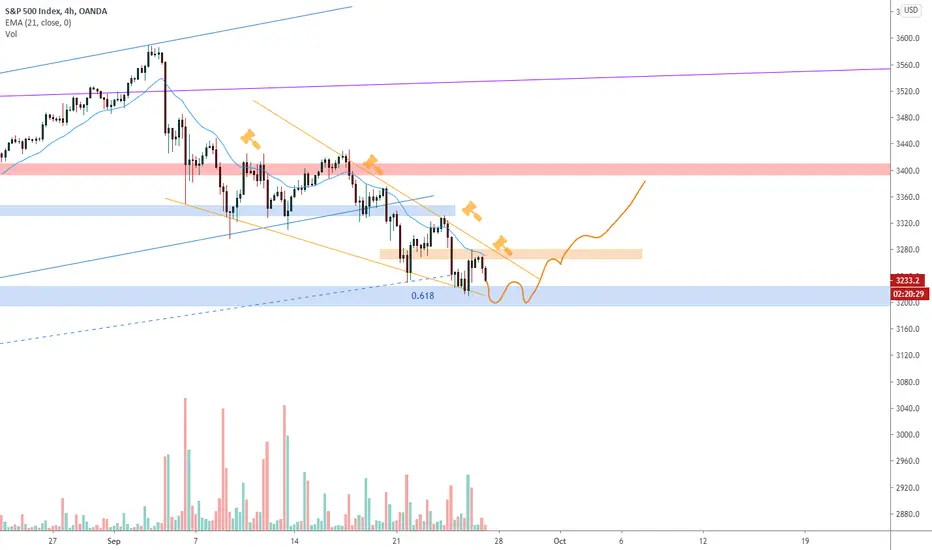
SP500 as expected from put last analysis almost reached the 0.618 fib level retracement of the previous bullish leg.
Price on the 4h chart always been pushed down by the ema 21 and created a wedge formation.
If the price will manage to close the week above the 3200 level, during next week we can expect a bounce over the daily support.
In the case the price will break above the 4h structure we can set a nice long order according to Plancton's strategy.
–––––
Follow the Shrimp 🦐
Here is the Plancton0618 technical analysis, please comment below if you have any question.
The ENTRY in the market will be taken only if the condition of Plancton0618 strategy will trigger.
Price on the 4h chart always been pushed down by the ema 21 and created a wedge formation.
If the price will manage to close the week above the 3200 level, during next week we can expect a bounce over the daily support.
In the case the price will break above the 4h structure we can set a nice long order according to Plancton's strategy.
–––––
Follow the Shrimp 🦐
Here is the Plancton0618 technical analysis, please comment below if you have any question.
The ENTRY in the market will be taken only if the condition of Plancton0618 strategy will trigger.
Nota
Nota

Exención de responsabilidad
La información y las publicaciones no constituyen, ni deben considerarse como, asesoramiento o recomendaciones financieras, de inversión, de trading u otro tipo, proporcionadas o respaldadas por TradingView. Obtenga más información en Condiciones de uso.
Exención de responsabilidad
La información y las publicaciones no constituyen, ni deben considerarse como, asesoramiento o recomendaciones financieras, de inversión, de trading u otro tipo, proporcionadas o respaldadas por TradingView. Obtenga más información en Condiciones de uso.