
S&P500 Recession Indicators - MACD > CCI > DPO vs candlesticks
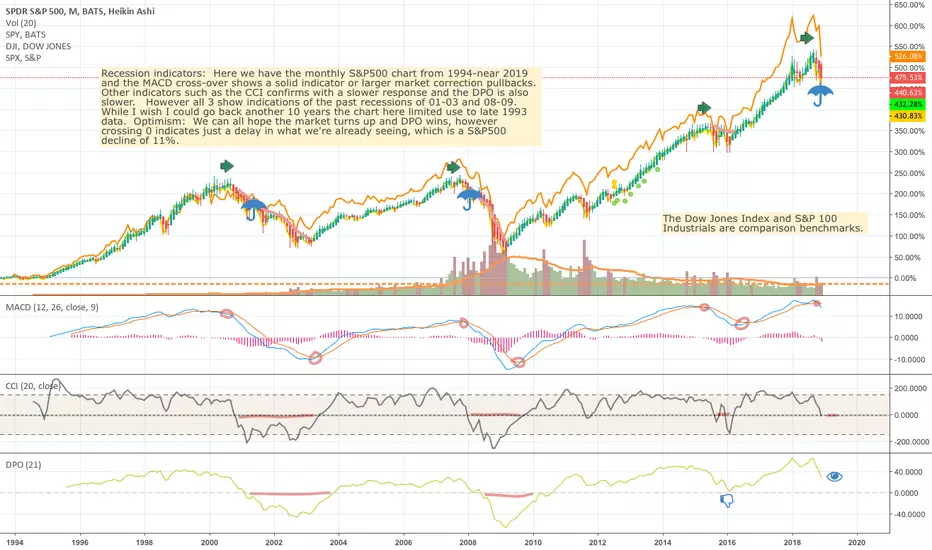
Here a chart of S&P500 from late 1993 to late 2018 on a monthly chart as indicators for major pullbacks.
MACD has fastest response, CCI next, DPO also good but laggard for people still holding.
MACD has fastest response, CCI next, DPO also good but laggard for people still holding.
Nota
Some might also see wave 1, 2 and cresting 3.Nota
Nota
Await MACD cross-over and CCI nearing 0 for good market re-entry, but some stocks will be sooner than others. 
Exención de responsabilidad
La información y las publicaciones no constituyen, ni deben considerarse como, asesoramiento o recomendaciones financieras, de inversión, de trading u otro tipo, proporcionadas o respaldadas por TradingView. Obtenga más información en Condiciones de uso.
Exención de responsabilidad
La información y las publicaciones no constituyen, ni deben considerarse como, asesoramiento o recomendaciones financieras, de inversión, de trading u otro tipo, proporcionadas o respaldadas por TradingView. Obtenga más información en Condiciones de uso.