
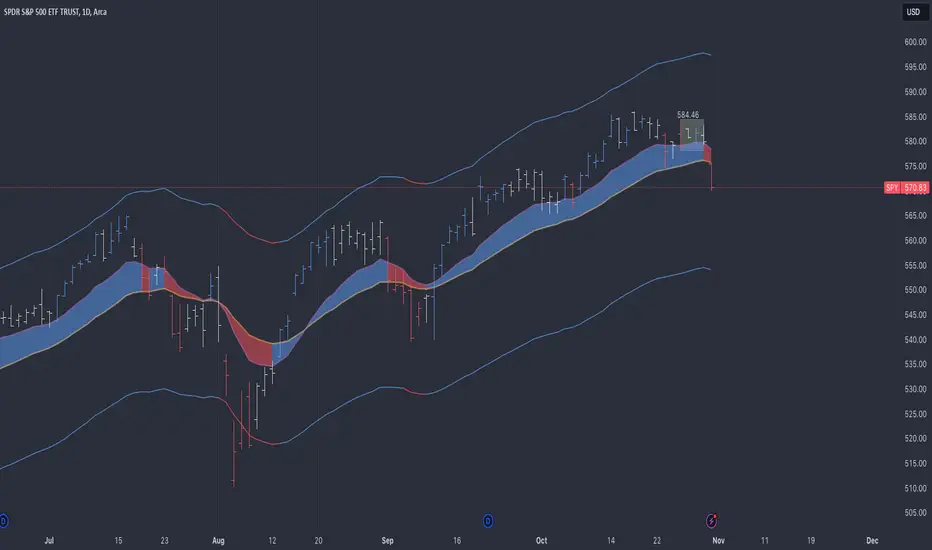
On the daily chart, there are three bearish signals without even considering indicators:
1. Price is below the EMAs.
2. With a gap down.
3. From a coil spring.
On the weekly chart, the trend remains intact. However, if we drop below the fast EMA, a significant test will be the slow EMA.

The key level to watch is the low of the daily channel line at $554, which aligns with the weekly slow EMA at approximately $551. For me, that represents the definitive line in the sand for SPY.
1. Price is below the EMAs.
2. With a gap down.
3. From a coil spring.
On the weekly chart, the trend remains intact. However, if we drop below the fast EMA, a significant test will be the slow EMA.
The key level to watch is the low of the daily channel line at $554, which aligns with the weekly slow EMA at approximately $551. For me, that represents the definitive line in the sand for SPY.

Exención de responsabilidad
La información y las publicaciones no constituyen, ni deben considerarse como, asesoramiento o recomendaciones financieras, de inversión, de trading u otro tipo, proporcionadas o respaldadas por TradingView. Obtenga más información en Condiciones de uso.
Exención de responsabilidad
La información y las publicaciones no constituyen, ni deben considerarse como, asesoramiento o recomendaciones financieras, de inversión, de trading u otro tipo, proporcionadas o respaldadas por TradingView. Obtenga más información en Condiciones de uso.